
Gas market of EU and UK
Summary
EU countries and UK have formed an integrated natural gas market. Existing bottlenecks of gas pipeline systems occasionally affect connectivity of the market and created some short-lived marker decoupling, but in general these restrictions are not material. Gas markets of these countries functions as a single mechanism. Most of EU countries with access to sea, as well as UK, have operating regasification terminals and are directly connected to the world LNG market.
EU has almost cut Russian gas import via pipelines. As of 2025 key suppliers of pipe gas to EU and UK are Norway, Algeria, Russian and Azerbaijan. In 2026 Russia supply gas only via one line of Turkish stream.
EU and UK collectively is one of the largest importers of LNG. In 2025, EU and UK discharged 359 million tons of LNG (excluding cabotage, including further re-export). That makes this joint market number one LNG importer in the world.
EU and UK gas market has one of the largest natural gas storage capacity in the world, with a storage capacity of 112 bcm. Regulatory requirements of European Commission for filling USG and actual demand from EU gas companies determine EU LNG import volume during gas summer and are one of key factors of world LNG spot market.
In recent years, EU and UK voluntarily cut twofold import of pipeline gas and became a balancer of the global LNG market. Demand for LNG in EU and UK has become a key element of pricing in the global spot LNG market.
As of 2025 USA is the number one LNG supplier in EU and UK with market share exceeding 60%. EU and UK is fully dependant on USA in energy area. Russia and Qatar are in Top 3 LNG suppliers. EU and UK is voluntarily cutting Russian piped and LNG supply since 2019 and plan to finish it in 2027. EU has started trade war with Qatar. In 2026 USA jeopardized Qatari gas industry. USA is on the way to became monopolistic supplier of LNG to EU and UK. EU and UK capitulated to Trump in tariff war and agreed to such monopoly.
EU is one of the world's emerging LNG bunkering hubs. Rotterdam, along with Singapore, is the world's leading LNG bunkering port. In 2025, LNG sales as marine fuel exceeded 1 ktd. Barcelona is the second-largest EU LNG bunkering port.
Map of gas industry
Natural gas production
Netherlands
Netherlands previously was top gas producer in EU. Groningen gas field was key Dutch field and one of the largest in the world. This field de facto created modern EU gas market. The field produced its first gas in 1963, production peaked in 1976, and shut down operations in 2024. The reason behind shutdown of the field is a large number of earthquakes at production sites.
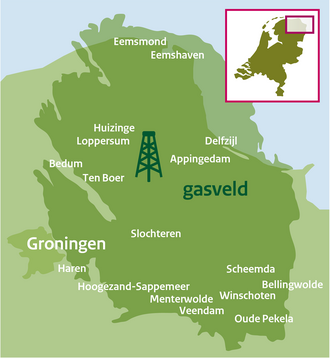
Map of the Groningen gas field
Romania
In 2025 Romania became top EU gas producer with 22 mcm of average production.
Cyprus
In recent years, Cyprus has discovered a number of large gas fields in its offshore economic zone - Kronos, Aphrodite, Pegasus. The total estimated reserves amount to about 566 billion cubic meters.
It is planned to start exporting to the rest of the bloc through Egyptian LNG plants starting in 2027.
Consumption
Europe's natural gas market is one of the largest in the world, along with the United States, China and Russia.
Europe collectively has the largest gas storage facilities in the world and is de facto (formerly along with Russia) the global balancer of the LNG market and largely determines the prices of spot LNG supplies. Europe's UGS facilities is one of the most important fundamental indicators of the global gas market.
The demand for gas is largely determined by temperature. Heating accounts for the vast majority of consumption during the cold season, including increased demand for electricity from gas-fired thermal power plants. There is a high seasonality in gas consumption - in the winter months, consumption is 3-4 times higher than demand in the summer months. In recent years, after the active commissioning of wind farms, wind conditions have also actively begun to affect short-term gas demand and, as a result, prices for the day ahead on gas exchanges (TTF, CEGH and others).
Industrial gas demand in Europe has been stagnating since 2022. European manufacturers in energy-intensive industries (starting with chemicals) cannot withstand price competition from competitors in the USA, China, Russia and the Middle East. European companies are actively shifting production to countries with low energy costs, as well as transforming from producers to research and financial companies in their industries.
EU has developed natural gas processing, primarily the production of ammonia and nitrogen fertilizers, and methanol. EU annual ammonia production capacity is about 20 MTPA, and methanol production capacity is about 3 MTPA.
Previously, domestic gas demand in Europe was covered by its own production. However, due to the active growth in gas demand and the development of the largest deposits (primarily Groningen in the Netherlands), the bulk of gas demand is covered by imports.
Gas-fired power generation
Overall installed capacity of gas-fired TPPs in EU and UK is 213 GW. Theoretical maximum demand from gas generation is 1.3 bcm/d.
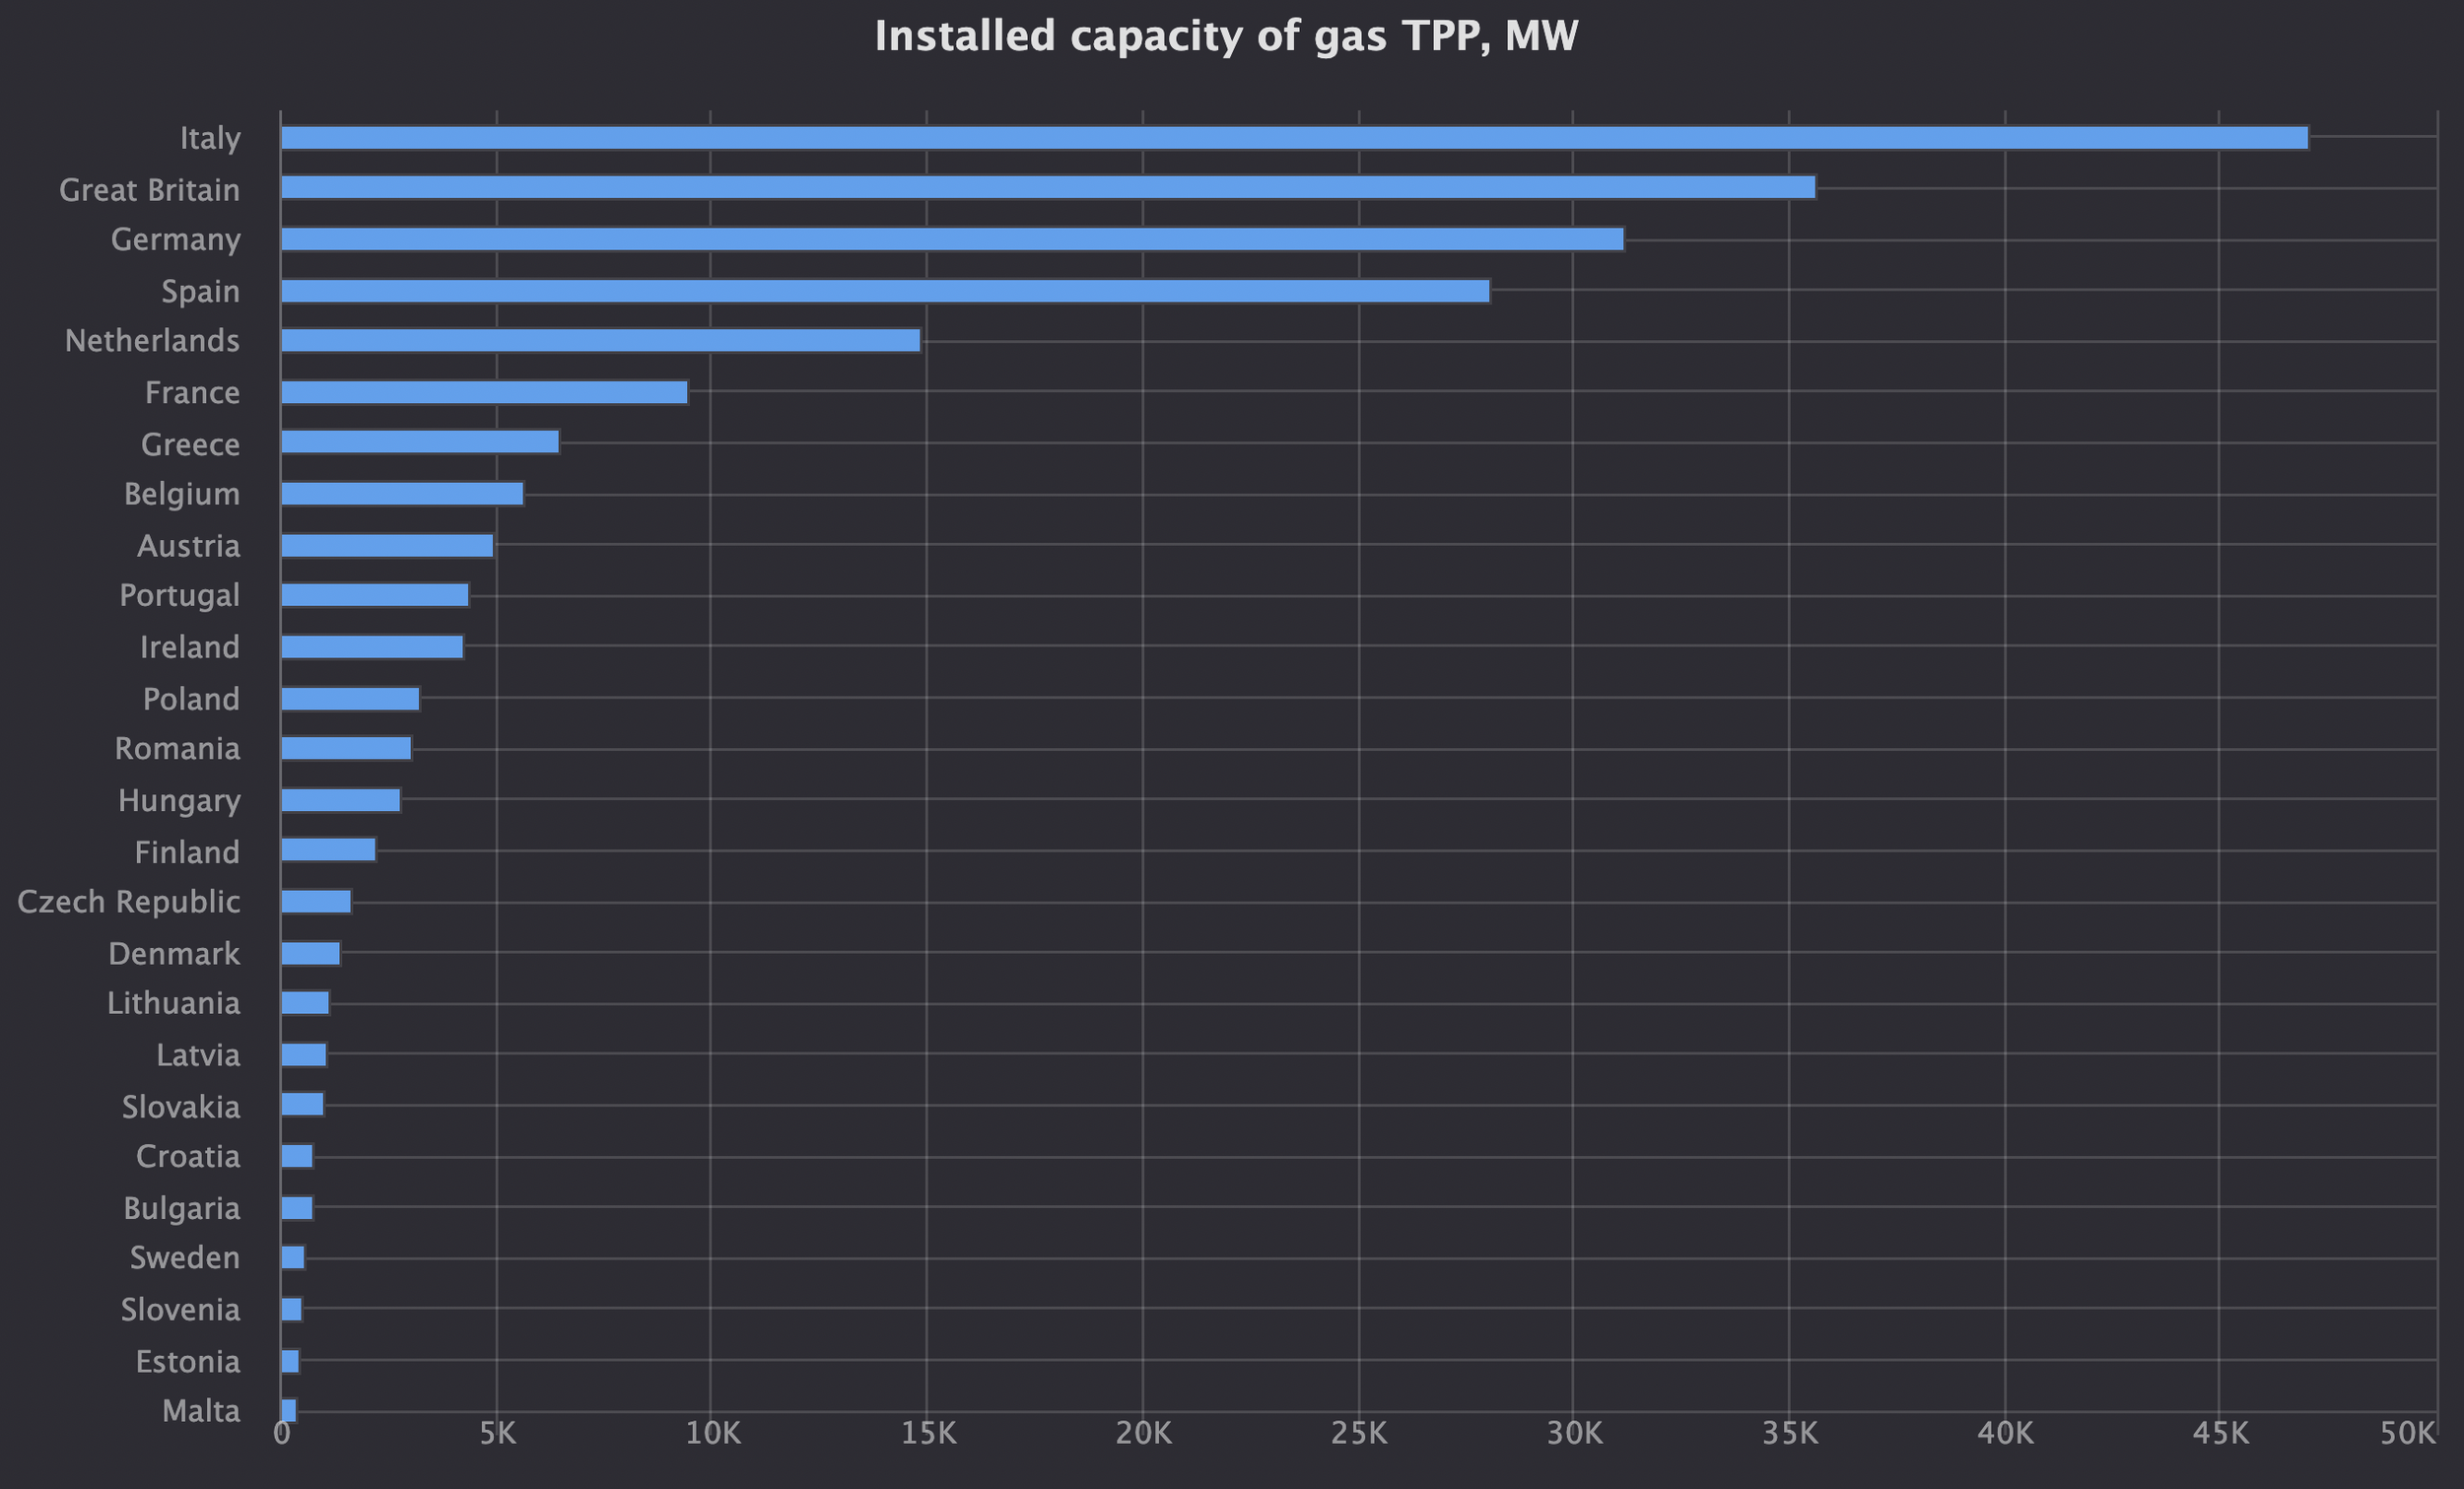
Installed capacity of gas TPPs in EU and UK
Planned tax on external imports of natural gas
European Commission plans to introduce another tax on the external import of resources to the EU - Methane Regulation (Regulation (EU) 2024/1787). Official wording is based on methane emissions at its production. Transportation and regasification segmets and foreign upstream projects controlled by EU companies will be excluded from the tax. De facto, this is a hidden taxation of gas supplies from the United States, Qatar, Algeria, and Azerbaijan.
In October 2025, Qatar's Minister of State for Energy and CEO of Qatar Energy, Saad bin Sharida al-Kaabi, explicitly indicated that Qatar was considering refusing to supply LNG to the EU if an attempt was made to confiscate the amount of the so-called fine.
In December 2025, the European Commission proposed to the LNG exporter from the United States the procedural facilitation of the “audit” of gas fields. The US Chamber of Commerce once again rejected both the procedural relief and the entire initiative, as the US government basically does not want to pay any tax on its LNG.
Pipeline gas imports
Russia
Russia was the key supplier of gas to EU until 2022. Pipeline supplies reached 400-450 mcm per day. After the blowing up of Nord Streams by US and Ukraine and Poland's blocking of supplies via the Yamal-Europe gas pipeline, supply volumes decreased fivefold to 80 mcm per day.

No one planned to hide responsibility for the explosion of Nord streams at the time of the explosions
As expected, Ukraine and the United States have completely stopped the transit of Russian gas through Ukraine to the EU since January 2025. Since 01.01.2025, the European market has lost pipeline gas in the amount of 41 million cubic meters of gas per day, which created additional demand for LNG from the EU in the amount of 11 million tons of LNG from the United States per year (slightly less than 3% from the global LNG trade).
For Russophobic reasons, the European Commission requires all EU countries, as well as states planning to join EU, to start terminating gas contracts with Gazprom Export. In Q2 2025, the European Commission presented the following action plan:
Self-restriction of EU countries regarding the conclusion of new contracts for the supply of pipeline gas and LNG starting from 01.01.2026.
“Termination” of short-term contracts by 17.06.2026.
The “termination“ of long-term contracts by 01.01.2028 for all EU countries except Slovakia and Hungary.
Since January 2025, Turkish Stream has been the only Russian gas supply channel to EU. In H1 2025, Russian supplies to EU via this route (including re-export of gas outside the EU) amounted to 43 mcm per day, which is 10% of 2021 import volumes. Of these, 21 mcm per day goes to Hungary, 7 - to Slovakia, 15 - to Serbia (including re-exports to non-EU Balkan countries), and 1 - to Greece. Some of physical molecules of Russian gas are likely to enter Ukraine from Hungary and Slovakia as part of Ukraine's commercial imports of European gas.
According to the terms of the agreements, European companies must pay fines for non-sampling of gas and even more so for its rupture. The European Commission does not want to pay penalties and is looking for ways to sign some kind of paper, according to which unilateral termination of international treaties without penalties stipulated in the treaties will be considered “legitimate” in the EU. The pocket Stockholm Arbitration Court is likely to be involved in this process. In his practice, there is already a precedent for “legitimizing” the termination of a similar contract between Ukraine and Russia without paying a corresponding fine to Ukraine. This process will finally disconnect the European gas market from supplies from Russia, which will bring additional losses to European companies and residents and lead to continued stagnation of energy-intensive industries in the EU. Gazprom will suffer even greater damage. It was gas sales to the EU that ensured the low level of domestic gas tariffs, as well as Gazprom's generous social program.
On 03.12.2025, the European Council and the European Parliament decided to abandon import of Russian pipeline gas. Pipeline gas supplies must stop no later than 30.09.2027, and in some cases before 01.11.2027. A transition period is provided for existing contracts. For short-term contracts signed before 17.06.2025, the ban will take effect from 25.04.2026 for LNG and from 17.06.2026 for pipeline gas.
Greece
As of 2025, there is a gas supply agreement between Gazprom export and state-owned DEPA (ΔΕΠΑ).
The current agreement with DEPA was signed in January 2022 and is valid until the end of 2026. Previously, there were other agreements between the same parties. The annual volume of supplies under the current agreement is 2 bcm (5 mcm per day). The agreement contains a ”take or pay" condition. The formula price has a basic reference to the TTF index (80% of the price) and oil quotations (20%). In March 2024, DEPA filed to the Stockholm Arbitration Court a standard retrospective price review with Gazprom Export. In July 2025, the parties reached a pre-trial settlement.
Due to the planned general self-restriction of EU in the supply of Russian gas, it is unlikely that this agreement will be renewed.
Norway
After the self-abandonment of Russian gas and the undermining of Nord Streams by the United States and Ukraine, Norway has become a key supplier of pipeline gas to the EU. By the end of January-February 2024, the volume of supplies amounted to 330 million cubic meters per day according to the results.
Algeria
Algeria is a significant supplier of pipeline gas to the southern EU countries.
Azerbaijan
As of the first half of 2025, Azerbaijan is the number four supplier of pipeline gas to the EU with a market share of 7%. Key consumers of Azerbaijani gas in the EU:
Italy - 60% of the market.
Bulgaria - 50%.
Greece - 18%.
De facto, Azerbaijani gas has replaced Russian gas in these markets.
In July 2025, European countries requested additional supplies from Azerbaijan in the amount of 14 bcm per year (38 mcm per day).
In December 2025, Hungarian state-owned energy company MVM signed a contract with Azerbaijan's SOCAR for the supply of 800 million cubic meters of natural gas over 2 years. Hungary is diversifying gas supplies despite supporting Russian gas imports.
Libya
Libya is a significant supplier of pipeline gas to the southern EU countries.
Pipeline gas re-export
Transit of Russian gas to Kaliningrad region via Lithuania
A ten-year agreement on transit of Russian gas through Lithuania to Kaliningrad Region expires at the end of 2025. The contract volume for transit is 2.5 bcma. The contract contains a condition - “transport or pay". The actual transit volumes in 2025 were at the contract level. The transit price under the expiring contract was 13 million euros / 1.2 billion rubles. Unit cost of transit is 0.02 AED / 0.04 CNY / 0.46 INR / 0.48 RUR / 0.61 US cents per cubic meter of natural gas.
An extension of the contract is expected to be signed. The President of Lithuania coordinates the possibility of the renewal with his superiors. Transit price will be increased 2.2 times to 29 million euros / 2.7 billion rubles. Unit cost of transit will increase to 0.05 AED / 0.10 CNY / 1.02 INR / 1.07 RUR / 1.35 US.
Serbia
As of 2025 Serbia recieve Russian gas through Turkish stream.
Ukraine
Since 2025, the Ukrainian gas market has completed its strategic integration to the EU gas market and has become a part of it.
Ukraine physically imports gas molecules from Europe through Slovakia (the pipeline's capacity is 42 mcm per day), Hungary (10) and Poland (6.2 until 30.06.2025, 12.4 - from 01.07.2025).
Preparation of physical and commercial infrastructure for the import of natural gas through the Trans-Balkan gas Pipeline in reverse mode was finalised in June 2025. New capacity is 3 mcm per day. This gas pipeline was originally built and has historically been used to supply Russian gas to the Balkans. After the launch of the Turkish stream in 2020, supplies moved from the Trans-Balkan gas pipeline to the Turkish stream due to lower level of hostility towards Russia from transit countries and lower transportation costs. As s consequences The Trans-Balkan gas pipeline went down. Ukraine's refusal to transit Russian gas from 01.01.2025 and relatively independent from Brussels governments of Hungary and Slovakia prompted launch of the Trans-Balkan gas pipeline in the opposite direction. Pipeline is filled by regasified US LNG discharged at new Greek Revithoussa terminal.
Key obstacle to the use this gas pipeline by Ukraine remains higher transportation costs - imports through the terminals of Swinoujscie (Poland) and Krk (Croatia) were cheaper. In Q2 2025, European gas transportation operators made a 46% discount for Ukrainian companies, but this still did not make this route commercially attractive compared to alternatives. Therefore, in the near future, this route will remain a reserve for Ukrainian companies and will be used only if the capacity of cheaper routes through Poland, Hungary and Slovakia are fully utilized.
On 01.07.2025, the operators of the gas transmission systems of Ukraine and Poland (OGTSU and Gaz-Systems, respectively) extended the agreement on guaranteed for Ukraine capacity until 30.09.2026. Moreover guaranteed capacity increased to 12.4 mcm per day (4.5 bcm per year). The Polish route de facto receives regasified LNG from the USA at the Swinoujscie terminal. Polish Orlen is a commercial intermediary, buying LNG from USA on its own account and reselling it to Ukraine (DTEK and Naftogaz).
The planned volume of gas re-export by the National Academy of Sciences of Ukraine in 2025 is 4.5-8.0 bcm (about 16 mcm per day).
Transnistria and Moldova
MOL company from Hungary is ready to sign a contract with Moldovagaz as part of gas supplies to Transnistria. The European Commission is ready to allocate 30 million euros to Moldova as emergency financial assistance, which Chisinau can use to purchase gas for Transnistria (this money may be enough to maintain heat and electricity in the homes of 350,000 Transnistrian residents until February 10, 2025). The EU is also preparing a large package of support in the energy sector for Moldova itself. On January 27, 2025, Moldova approved the transfer of 3 million cubic meters of gas to Pridnestrovie. In response to financial assistance from the EU, Transnistria will supply energy to Moldova at pre-crisis cost. Moldova and Transnistria introduced an emergency regime at the end of December 2024, when it became clear that Chisinau could not reach an agreement with Gazprom on the settlement of historical debts. Russian gas has stopped flowing to the Moldovan HPP since January 2025, while Ukraine has announced that it will no longer transport gas from the Russian Federation on its territory.
Gas reserves in UGS
Gas reserves are a key indicator of the balance of the European gas market. The compliance of gas reserves with the target level determines the necessary rates of their replenishment.
Since June 2022, the target level of gas reserves for the EU has been determined for the most part by the European Commission using the gas storage regulation. Some countries also have local requirements set by local governments.
The practice of conserving reserves in Europe has undergone major changes in recent years. Due to lower volumes of constant flowing pipeline gas, ensuring gas demand through UGS plays an increasingly important role in winter. Seasonality is becoming more and more evident in this market. The accumulated reserves at the beginning of the gas winter are getting bigger and bigger every year, however, the rate of gas consumption during the gas winter is also breaking records every year.
According to the current version of the regulations as of 02.07.2025, the following basic standards apply for target reserves: the peak level of active gas reserves in the period from October 1 to December 1 should be 90% of the total storage capacity. There is also a threshold of 5% of the allowable deviation from the target. As of 07/02/2025, this corresponds to 92.7 billion cubic meters in the EU UGS (85% of the active capacity of 109 bcm) plus 1.5 bcm in UK UGS (the full active capacity of these UGS). In total, 94 bcm in the period from the 274th to the 335th day of the year.
In January 2025, Bulgartransgaz began implementing a phased expansion of the Chiren UGS (the only gas storage facility in Bulgaria). The project aims to increase the active gas capacity to 1 billion cubic meters from the current 550 million cubic meters. The project is of strategic importance for improving energy security and increasing the competitiveness and liquidity of the natural gas market in Bulgaria and the Southeastern European region. The estimated cost of the expansion is 5.7 billion rubles. The project is funded by the European Executive Agency for Climate, Infrastructure and Environment (CINEA). The project also aims to increase the daily extraction capacity to 10 million m3 per day and the injection capacity to 8 million m3/day from the current maximum daily extraction capacity of 3.82 million m3/day and the maximum daily injection capacity of 3.2 million m3/day.
The required replenishment rates determine the LNG import plan. Since 2022, LNG has been the balancing resource of the European gas market and has replaced Gazprom in this regard.
Regasification terminals
As of 10.02.2026, there are 41 regas terminals in EU and UK with total regasification capacity of 212 MTPA, which is equivalent to 17.7 million tons per month.
During 2022-25, EU has built required regasification terminals. At the moment, there are no infrastructural bottlenecks on LNG imports, including during winter peak period. At this stage, new regas facilities are being built to optimize transportation costs and create options for gas sources in individual countries. Construction of regasification terminals in EU in 2026 will receive a new impetus thanks to 4 projects in Italy.
Netherlands
In December 2025 Zeeland Energy Terminal developed by VTTI and Höegh Evi passed FID. The terminal will be located in the Vlissingen-Oost port area of Zeeland province. ZET will be a floating terminal for importing LNG with a direct connection to the country's national gas network. ZET FSRU is scheduled to be commissioned in Q3 2029.
Belgium
New expansion project of the only Belgian regasification terminal in Zeebrugge is scheduled to be launched in March 2026. Capacity of the regasification terminal will be increased from 11.3 to 12.6 MTPA.
Germany
Сurrent capacity of the regasification terminals in Germany is 18.8 MTPA, which is equivalent to 1.6 million tons per month. At the same time, maximum volume of LNG imports was reached in June 2025 - 964 kt (utilization rate of 60%). Germany is facing an oversupply of regasification capacity. All German terminals are FSRU, which are more expensive than onshore faclitites.
On 16.05.2025, the second Excelsior FSRU (9239616) began operating in German port Wilhelmshaven. It is planned that 1.9 bcm of gas will be delivered through this terminal in 2025. Plan for 2026-2027 is 4.6 bcma.
The first FSRU in Wilhelmshaven - Hoegh Esperanza (9780354) started operating in December 2022. All tLNG supplied to the terminal is from USA.
At the same time, Egypt leased one of idle German FSRU currently located in the port of Sassnitz (formerly Mukran).
Poland
State-owned company Gaz-System continues construction of the country's second regasification terminal in the port of Gdansk. It will be the first FSRU in Poland. Commissioning is expected in Q1 2028.
Italy
Expansion project of Adriatic LNG Terminal is scheduled to be launched in January 2026. The capacity of the regasification terminal will be increased from 6.6 to 7.6 MTPA.
In total, 4 terminals with total capacity of 19.2 MTPA are planned to be commissioned in Italy in 2026: in addition to the Adriatic LNG Terminal, Ravenna LNG Terminal, Gioia Tauro LNG terminal and Porto Empedocle LNG Terminal.
Croatia
The operator of Croatia's gas transportation system, Plinacro, has received 54.4 billion rubles (533 million euros) from the EU's so called “Economic Recovery and Sustainability Plan” for Croatia in spring 2024 for the construction of four gas pipelines that will transport gas from LNG terminal on Krk island to Slovenia, Hungary and other Southeastern European countries. Croatian government has now declared this ancillary infrastructure a strategic investment project, with a total cost currently of 534 million euros.
The project includes the main gas pipeline system in the Omisalj-Zlobin, Zlobin-Bosilevo-Sisak-Kozarac and Kozarac-Slobodnica sections, as well as the system of intercontinental gas pipelines with Slovenia in the Luchko-Zabok-Rogatec section.
58 km long Zlobin–Bosilevo gas pipeline will increase gas transportation from the existing LNG terminal to Croatia, Slovenia and Hungary to a capacity of about 3.5 billion cubic meters per year. Its construction is scheduled to be completed in the first quarter of 2025.
Work will also begin soon on 36-kilometer Zabok-Luchko pipeline, which will increase capacity of the pipeline towards Slovenia from the current 0.26 to 1.5 bcma. Planned completion timeline is in 15 months from start of work.
As for the third main gas pipeline, 21-kilometer Kozarats-Sisak pipeline, public procurement process is underway, as well as preparatory measures for a public tender for Bosilevo-Sisak pipeline, which will cover 101 kilometers. New routes will increase transport capacity to neighboring countries from 0.26 to 1.5 bcma to Slovenia and from 1.7 to 3.5 bcma to Hungary.
Capacity of the LNG terminal itself is scheduled to be increased from 2.1 to 4.7 MPTA in November 2025.
Construction of these four gas pipelines with a total length of 216 kilometers, EU pressure over Serbia and Hungary and continued elimination of Russian piped gas will make Croatia a regional energy center.
LNG import
Discharges
The largest importers in Q2 2025:
France - 5.6 million tons, which is equivalent to 20% of total imports.
Spain - 4.9 (17%).
Netherlands - 4.1 (15%).
Suppliers
USA
The United States is the leading supplier of LNG to the EU and the UK, which has been achieved by military and political methods since the beginning of the formation of the LNG industry in the United States. The share of total foreign imports has steadily exceeded 50% since 2022. LNG imports from the US to the EU and the UK are fairly stable after their rapid growth in 2022. The EU and the UK are critically dependent on the United States for energy.
As a result of the launch of new LNG facilities in the United States (Plaquemines, the third phase of Corpus Christi) and US trade deals with the UK and the EU, we should expect a further increase in the US share in the US gas market at the expense of Russia and Qatar, with the second priority.
Russia
Russia ranks the second in Q2 2025 despite the political attack on the Russian LNG industry by the European Commission, Eastern and Northern European countries and the United States that began in the second half of 2024. The main prohibitions include:
“Waiver” of obligations of French and Belgian regas terminals under its long-term LNG transshipment contracts with Novatek (so-called ban of Russian LNG transhipment and re-export).
Self ban for purchase of LNG from Arctic LNG-2 and pressure on third party countries.
Refusal to make payments for gas through Gazprombank, using SWIFT, and almost complete restrictions on transfers in dollars, euros, and rubles.
Refusal to use some Artic-class gas carriers.
Refusal of transshipment of LNG through the floating storage of Saam LNG.
Germany's nationalization of Gazprom Export's LNG business.
France, Spain and Belgium are key importers of Russian LNG.
France are imported 1463 kt of LNG in Q2 2025.It is import LNG under long-term contract of TotalEnergies with Yamal LNG (2.6 MTPA till 2032), where it also holds 20% share in Yamal LNG plant itself. Previously TotalEnergies defaulted on its obligation under long-term contract (equity entitlement) with Arctic LNG 2 (2 MTPA till 2044), where it holds 10% share. In case of more EU attacks on Russian LNG industry, further French defaults on gas contracts or within future settlement of 200+ bEUR debt of EU to Russia, TotalEnergies presumably could lost its 20% share of Yamal LNG and 10% of Artic LNG 2.
Spain imported 923 kt from Russia in Q2 2025. It imports under long-term contract of Naturgy with Yamal LNG (2.5 MTPA till 2043).
Russian share in EU LNG import in H1 2025 amounted to 15%. Some of these volumes will be re-exported further outside the EU. After the strengthening of bans on the re-export of Yamal gas from the ports of France and Belgium, it is reasonable to expect new logistics schemes and a formal reduction in the share of LNG from Russia in the EU and UK markets.
Qatar
Qatar is the number three supplier of LNG to EU and UK. Qatar is consistently increasing its penetration into the European gas market, including long-term lease of regasification facilities. Thus, Qatar Energy controls supply chain from natural gas well to wholesale gas sales in North-Western Europe.
In Q4 2024 European Commission due to Qatar's non-subordination to Europe (the official wording, as always in Europe, is different - due to “non-compliance with environmental norms and social standards”) announced an additional tax (formally in the form of a fine) on LNG imports from Qatar in the amount of 5% of global revenue Qatar Energy. Estimated amount of the payment requested by the EU for the right to continue supplying Qatari gas to the block is 8 bAED / 16 bCNY / 181 bINR / 210 bRUR / 2 bUSD. EU had previously planned a similar scheme for gas from Russia (the official wording was based on environmental friendliness).
In October 2025, Qatar's Minister of State for Energy and CEO of Qatar Energy, Saad bin Sharida al-Kaabi, explicitly indicated that Qatar was considering refusing to supply LNG to the EU if an attempt was made to confiscate the amount of the so-called fine.
UAE
In February 2026, German energy company RWE signed a LNG SPA with ADNOC of UAE. The contractual volume of supplies is 1 MTPA for 10 years.
Foreign LNG projects
EU and UK companies are actively investing in the implementation of foreign LNG projects.
Key foreign projects:
Nigeria LNG (22.2 MTPA of operating capacity and 11.4 under construction). British Shell has 25.6% stake in the project.
Congo LNG. Two floating LNG plants with a combined capacity of 3 MTPA. Italian Eni owns 65%.
Coral in Mozambique. One operating floating LNG plant with a capacity of MTPA and a similar one under construction. Italian Eni owns 36% and Portuguese Galp owns 10%.
Angola LNG (5.2 MTPA). Italian Eni has share of 13.6%.
Floating LNG plants “Big Turtle Ahmeimah” in Mauritania and Senegal (1.25 MTPA of operating capacity and 1.25 under construction). British BP has 33% share.
Yamal LNG (17.4 MTPA) and Arctic LNG 2 (13.2 MTPA of operating capacity and 6.6 under construction). French TotalEnergies has stakes in these projects. These shares are currently blocked by the Russian government in response to the theft of Russian assets in the EU.
Sakhalin-2 (9.6 MTPA). British Shell has 27.5% stake in the project. This share is currently blocked by the Russian government in response to the theft of Russian assets in the UK.
Qatar (77.1 MTPA of operating capacity and 31.2 under construction). French TotalEnergies has a minority stake of 6.3-9.4% in the lines of Qatari LNG plants. British Shell also has a minority stake in the project.
Qalhat LNG in Oman (11.4 MTPA). British Shell has 30% stake in the project, while BP has 20% stake.
Tangguh LNG in Indonesia (11.4 MTPA). British BP has 37% stake in the project.
Papua LNG (8.3 MTPA). French TotalEnergies has 40% stake in the project, while British BP has 38%.
Floating LNG plant “Prelude” (3.6 MTPA). British Shell has 67.5% share.
Gorgon LNG (15.6 MTPA). British Shell has 25% share.
Wheatstone LNG (8.9 MTPA). British Shell has 13.6% share.
Ichthys LNG in Australia (8.9 MTPA). French TotalEnergies has 24% stake in the project.
Cameron in the USA (13.5 MTPA). French TotalEnergies has 16.6% stake in the project.
Rio Grande LNG in the USA. The plant is under construction. The capacity will be 23.1 MTPA. French TotalEnergies has 16.7% stake in the project.
Canada LNG (14 MTPA). British Shell has 40% share.
Peru LNG (4.5 MTPA). Spanish Natugy owns 20% of the project.
LNG re-export
Montoir-de-Bretagnie and Zeebrugge was transhipment hubs for Yamal LNG. After European Commission has banned transhipment of Russian LNG in EU ports Yamal changed logistics scheme and omits these EU ports.
Notes:
Join Seala AI’s Linkedin page to be informed for all new future releases with new dashboards and insights.
Non-mainstream oil and gas news and views are available in Seala AI’s telegram channel.
Full set of reports for each country and much more information are available via Seala AI terminal.