
LNG Module
LNG module cover the following data:
LNG plants
Regas terminals
LNG carriers
Maritime LNG trade
LNG contracts
LNG bunkering
Natural gas production
European UGS levels
Gas pipelines
Gas thermal power plants
Gas companies
LNG Plants
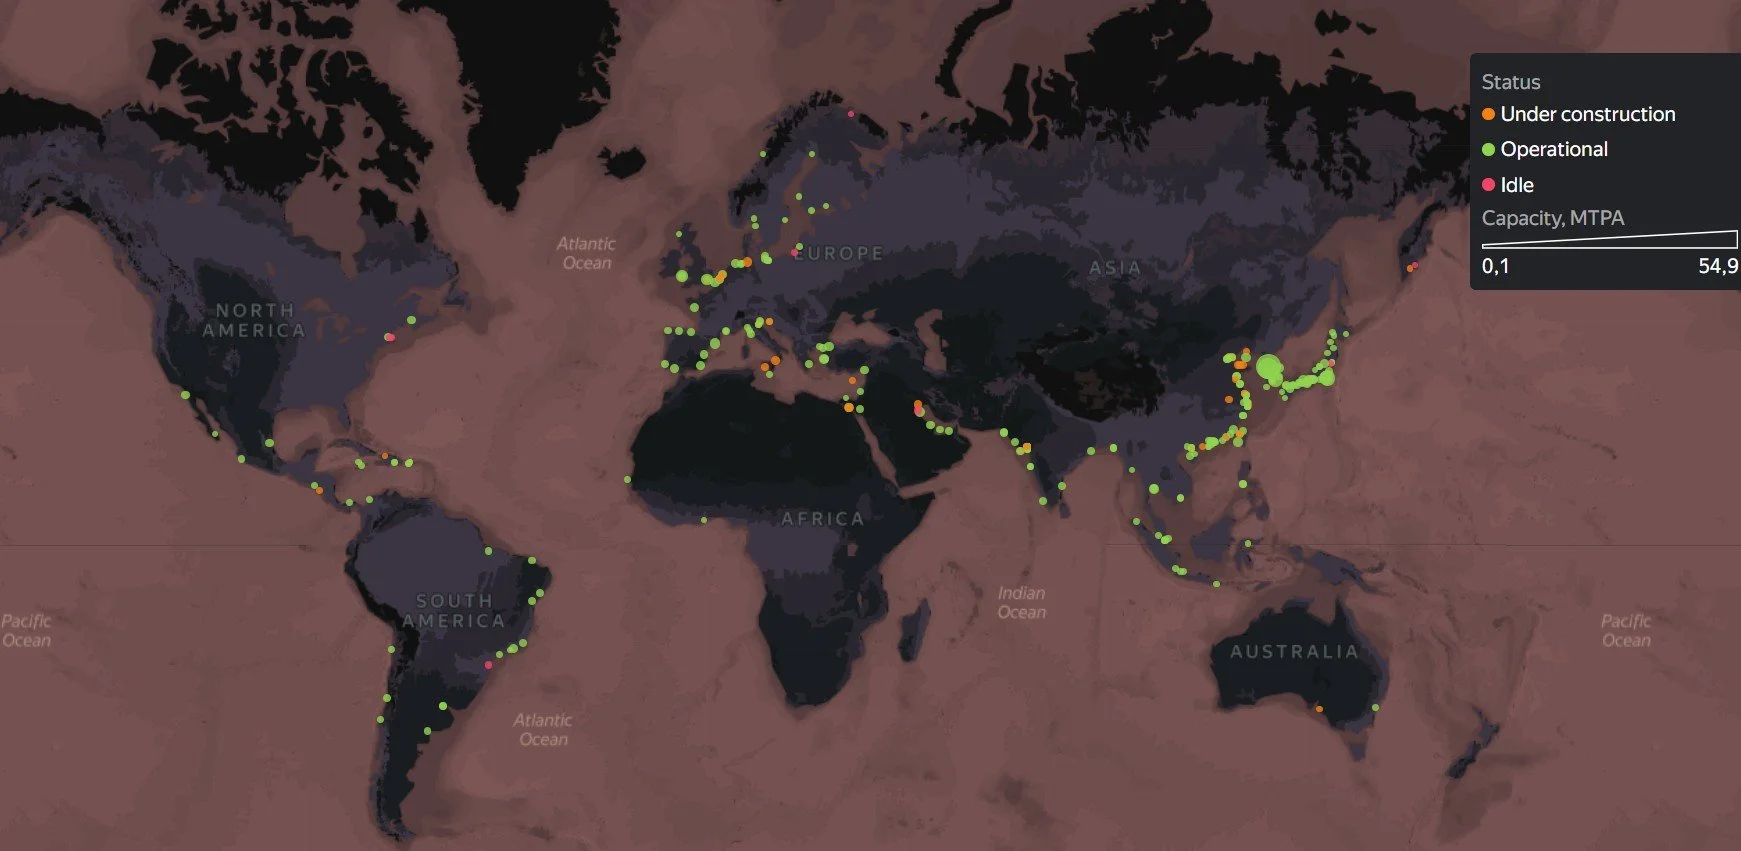
Interactive map of LNG plants with description of train status, design characteristics, owners, and commissioning dates.
Information on LNG liquefaction projects and statistics on it.
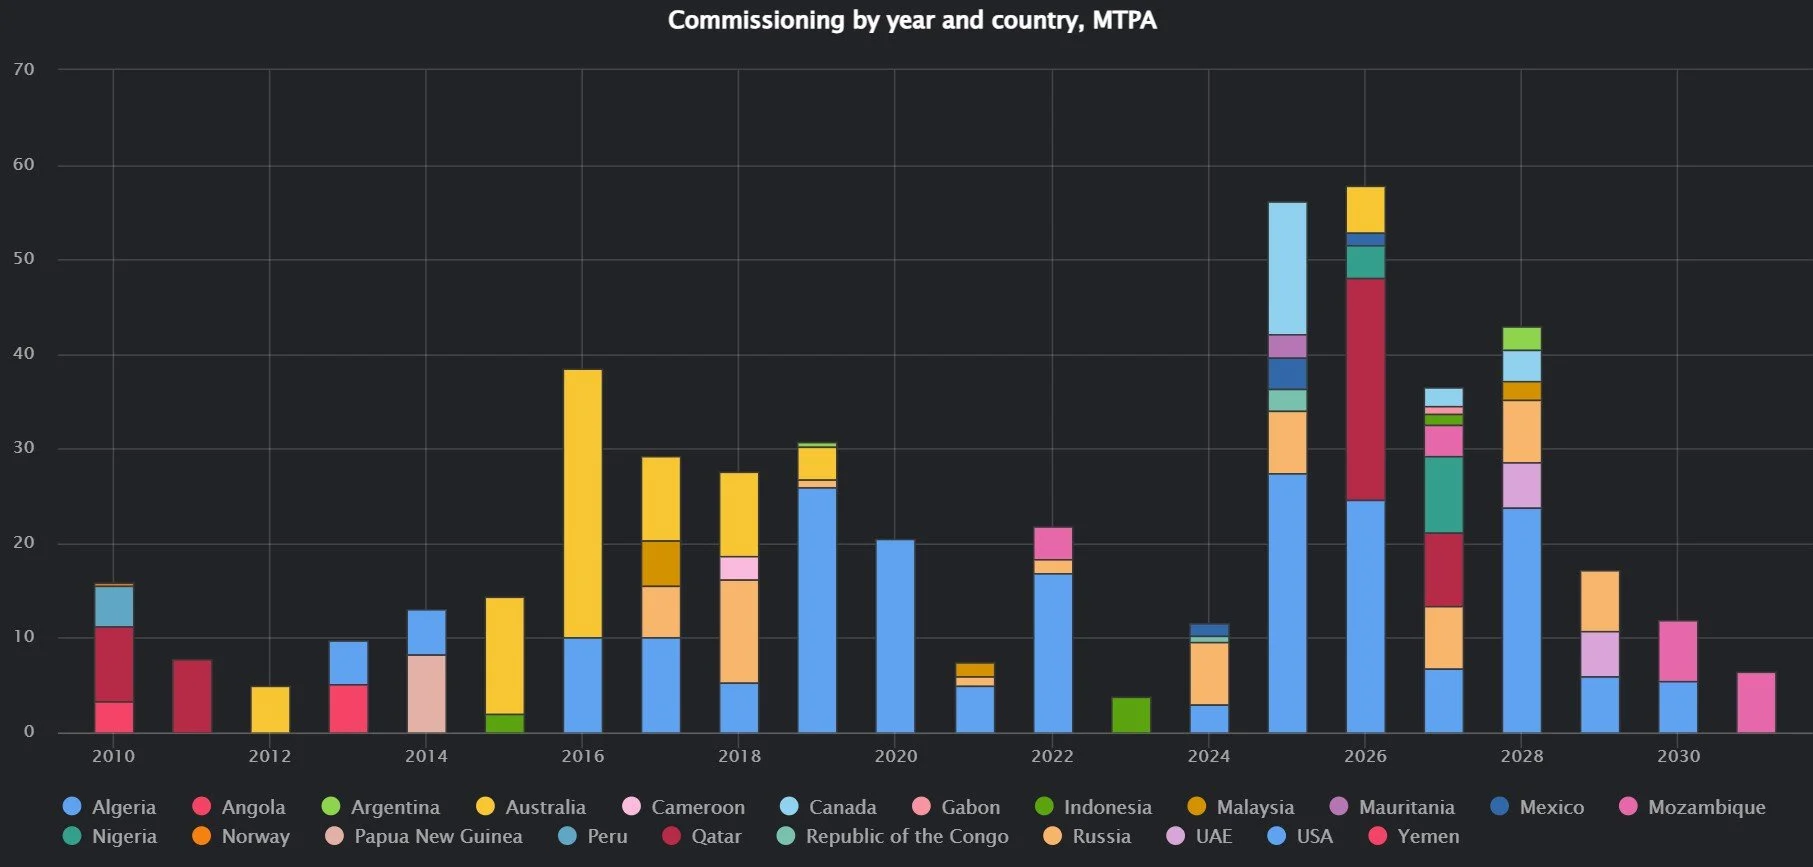
LNG plant commissioning by year and country
Country profiles.
Regas Terminals
Interactive map of regasification terminals with description of status, design characteristics, owners, and commissioning dates.
Interactive map of regasification terminals
Information on regasification capacity commissioning projects and its analytical aggregation.
LNG carriers
Descriptive characteristics of the LNG fleet: status, engine type, age, age category, flag, country of registration, carrying capacity.
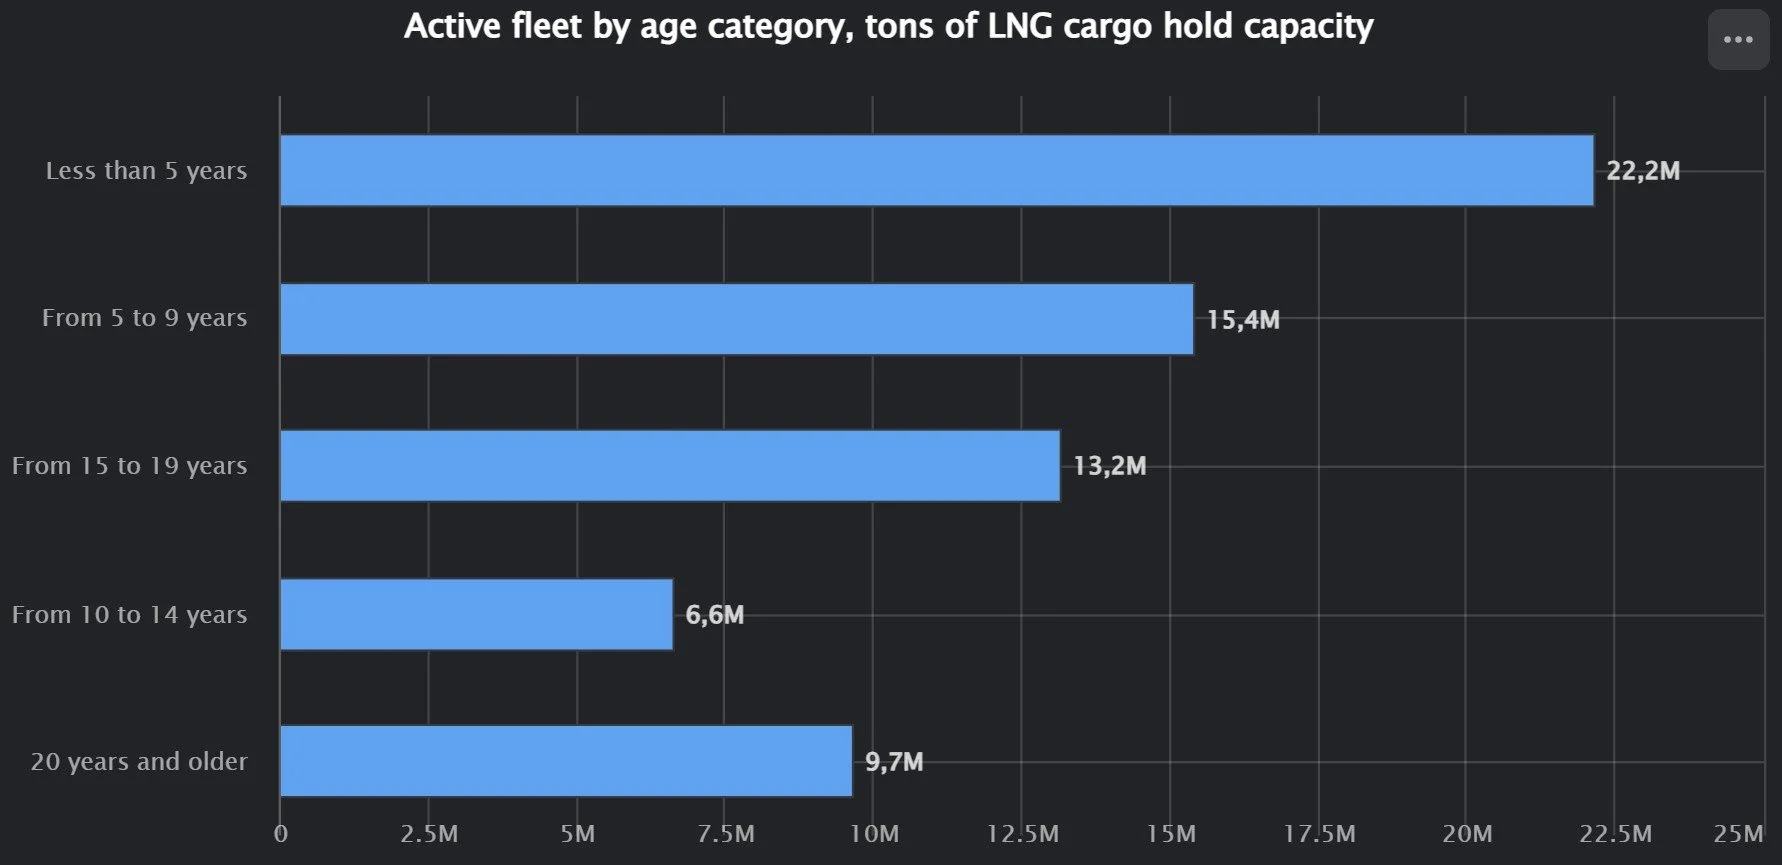
Age structure of active LNG vessels
Statistics on the construction of LNG carriers in various analytical sections: by year, by country.
Operational information on commissioning of new LNG carriers. If necessary, statistics on shipyards and types of gas carriers can be provided per request.
Transactions list and analysis of the secondary market for the purchase and sale of LNG carriers, including buyers and sellers, the cost of gas carriers in dollars, dirhams, rupees and yuans.

Value curve of LNG carriers by deadweight and age, million of US dollars
LNG Transportation
Interactive live map of the LNG industry with location and supporting information on gas carriers, LNG plants and regasification terminals.

Statistical volumes of LNG loading and unloading by country for the last 365 days, calendar year, and quarter.
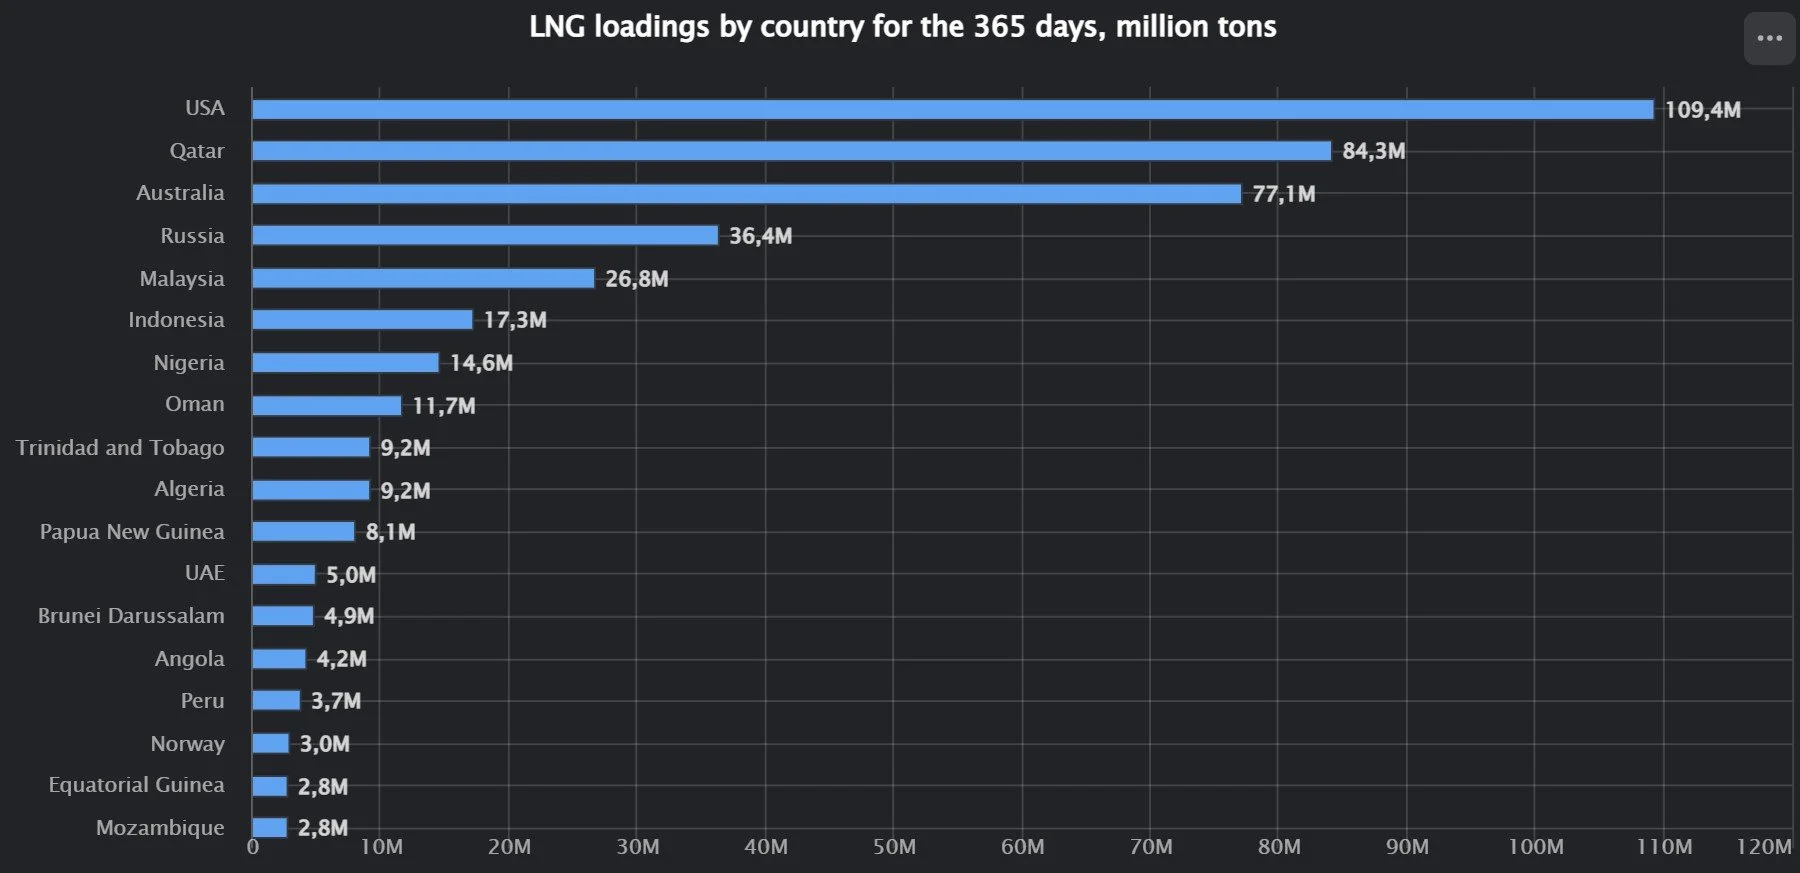
LNG loadings by country for the 365 days, million tons
LNG carrier tracker.

Voyages, loading and discharges of a selected LNG carrier for a selected period of time
Vojage time dynamics for typical routes. The list of routes can be customized to suit the needs of Terminal users.
LNG Trade
Operational data on loading, exporting, unloading, and importing large and medium-tonnage LNG shipments by sea on detailed and aggregated levels. As of May 2025, the achieved accuracy is at least 97% for global shipments (excluding LNG bunkering).

Monthly loading volumes for selected country
Trade routes for LNG transportation by sea, country-to-country supply tables for the period. Summary tables of shipments between regions. It is possible to provide information in any detail. Data on shipments has been available since August 2022.

Discharge countries of Russian LNG for the last 365 days
Long-term LNG supply contracts
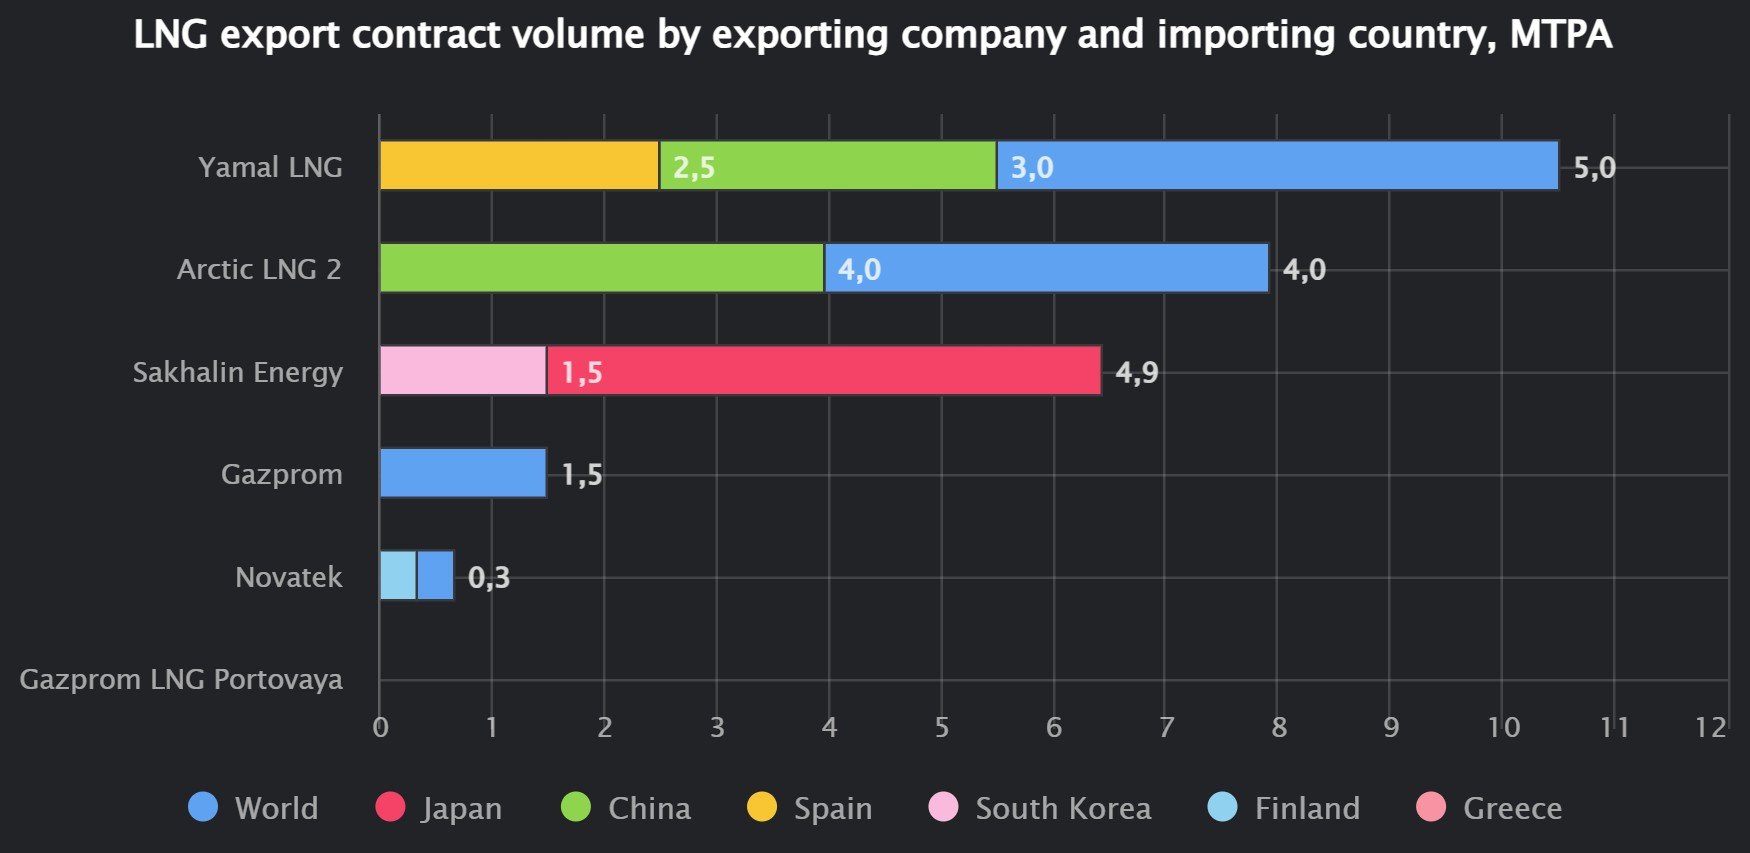
Binding LNG contracts for selected exporting country
LNG Bunkering
Statistics on LNG sales as a bunker in Singapore and Rotterdam.
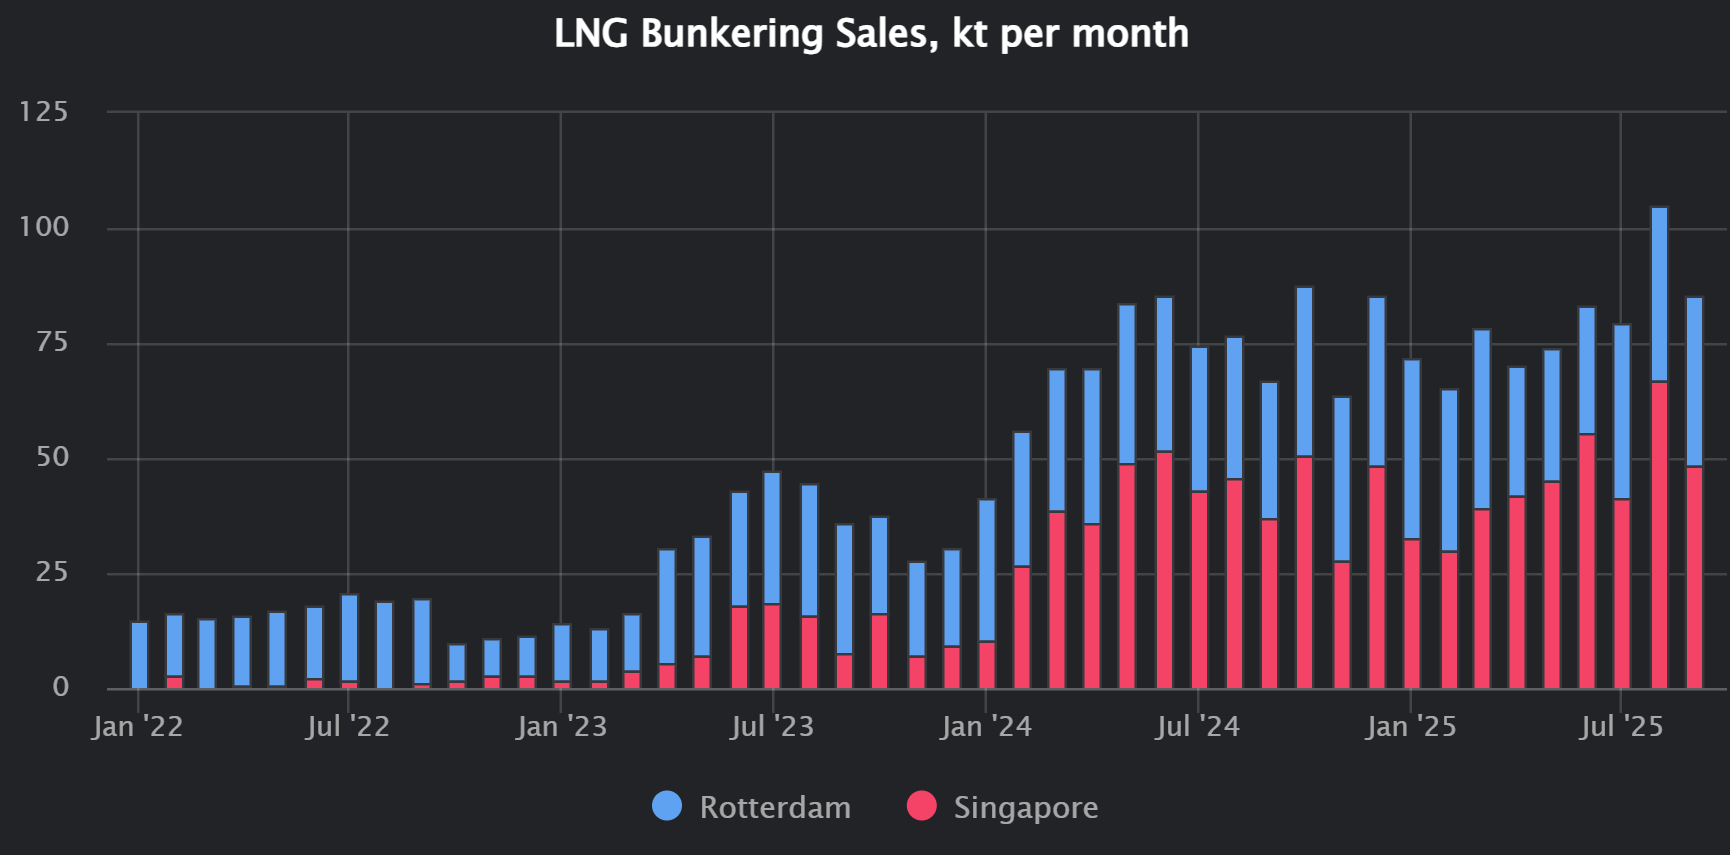
LNG bunkering by months
The fleet and the operation map of LNG bunkers.
Natural gas production
Map of gas fields and details on it.
Gas production and design capacities of gas fields.
European gas storage
Storage levels, injection and withdrawals of natural gas into UGS facilities in the EU, Great Britain and Ukraine.
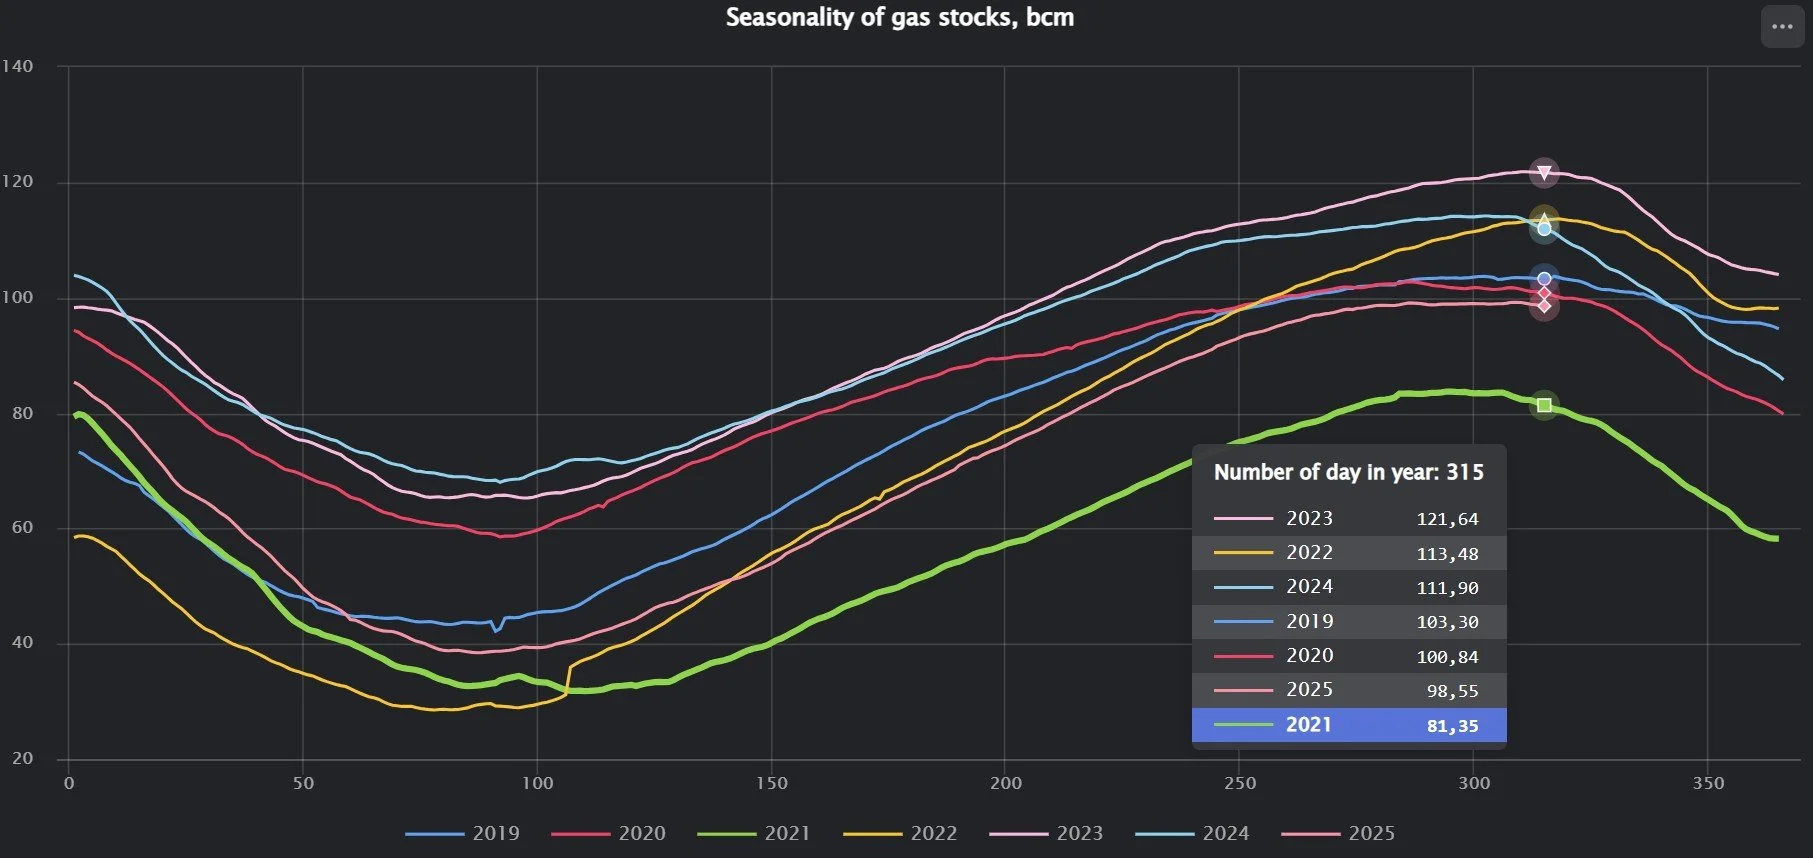
Seasonality of gas stocks, bcm
Gas pipeline
List and map of gas pipelines.
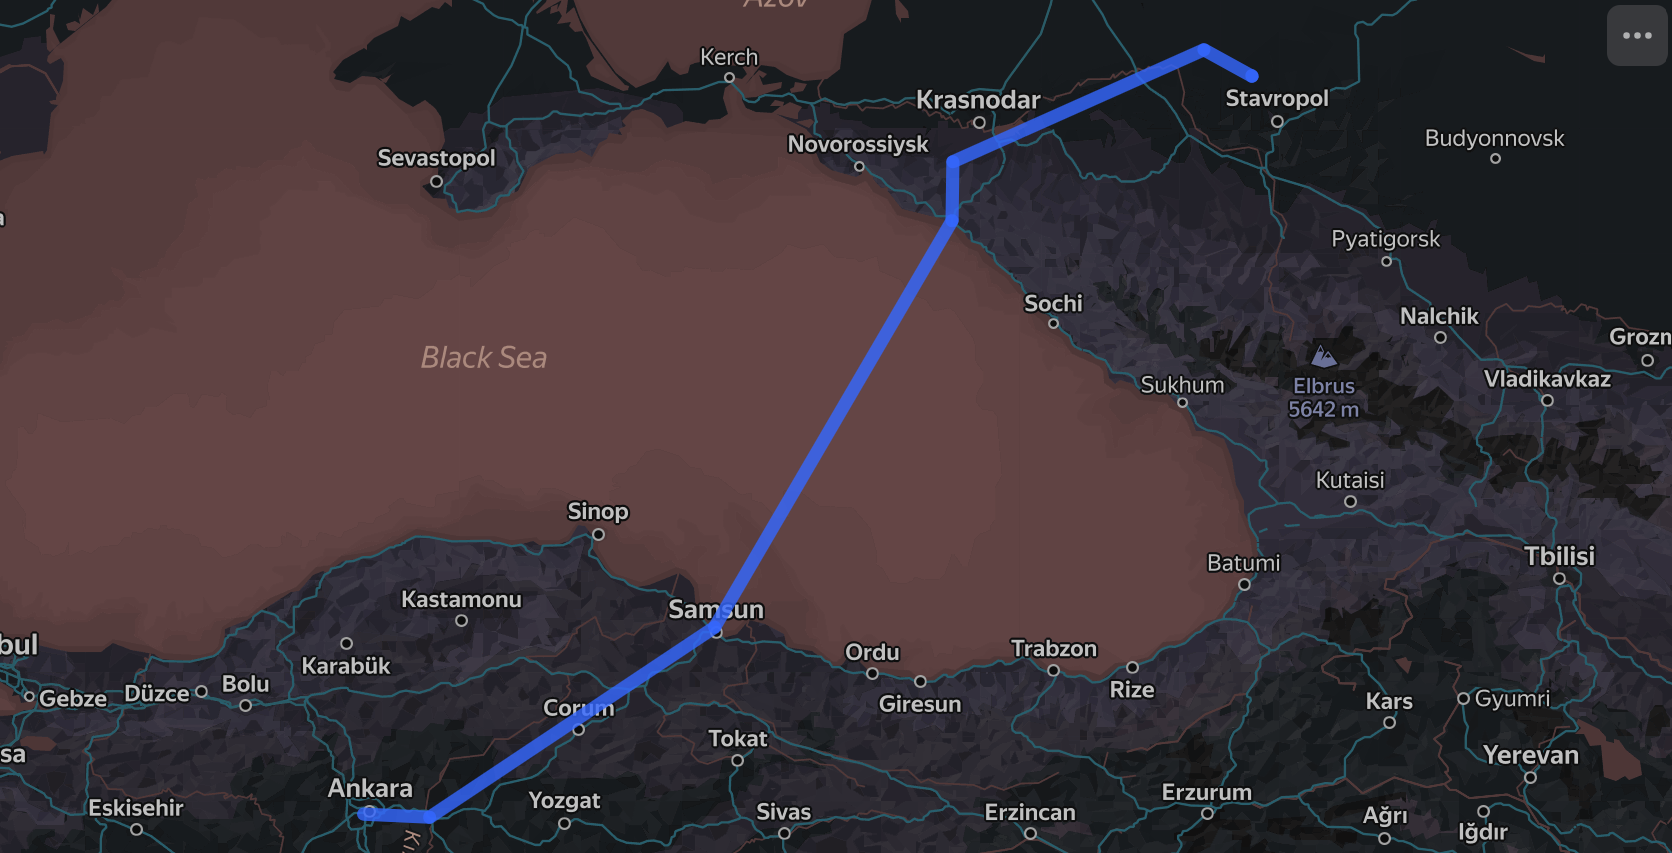
Map of selected gas pipeline
Gas TPP
List and map of gas TPP.
Installed capacity of gas TPP.
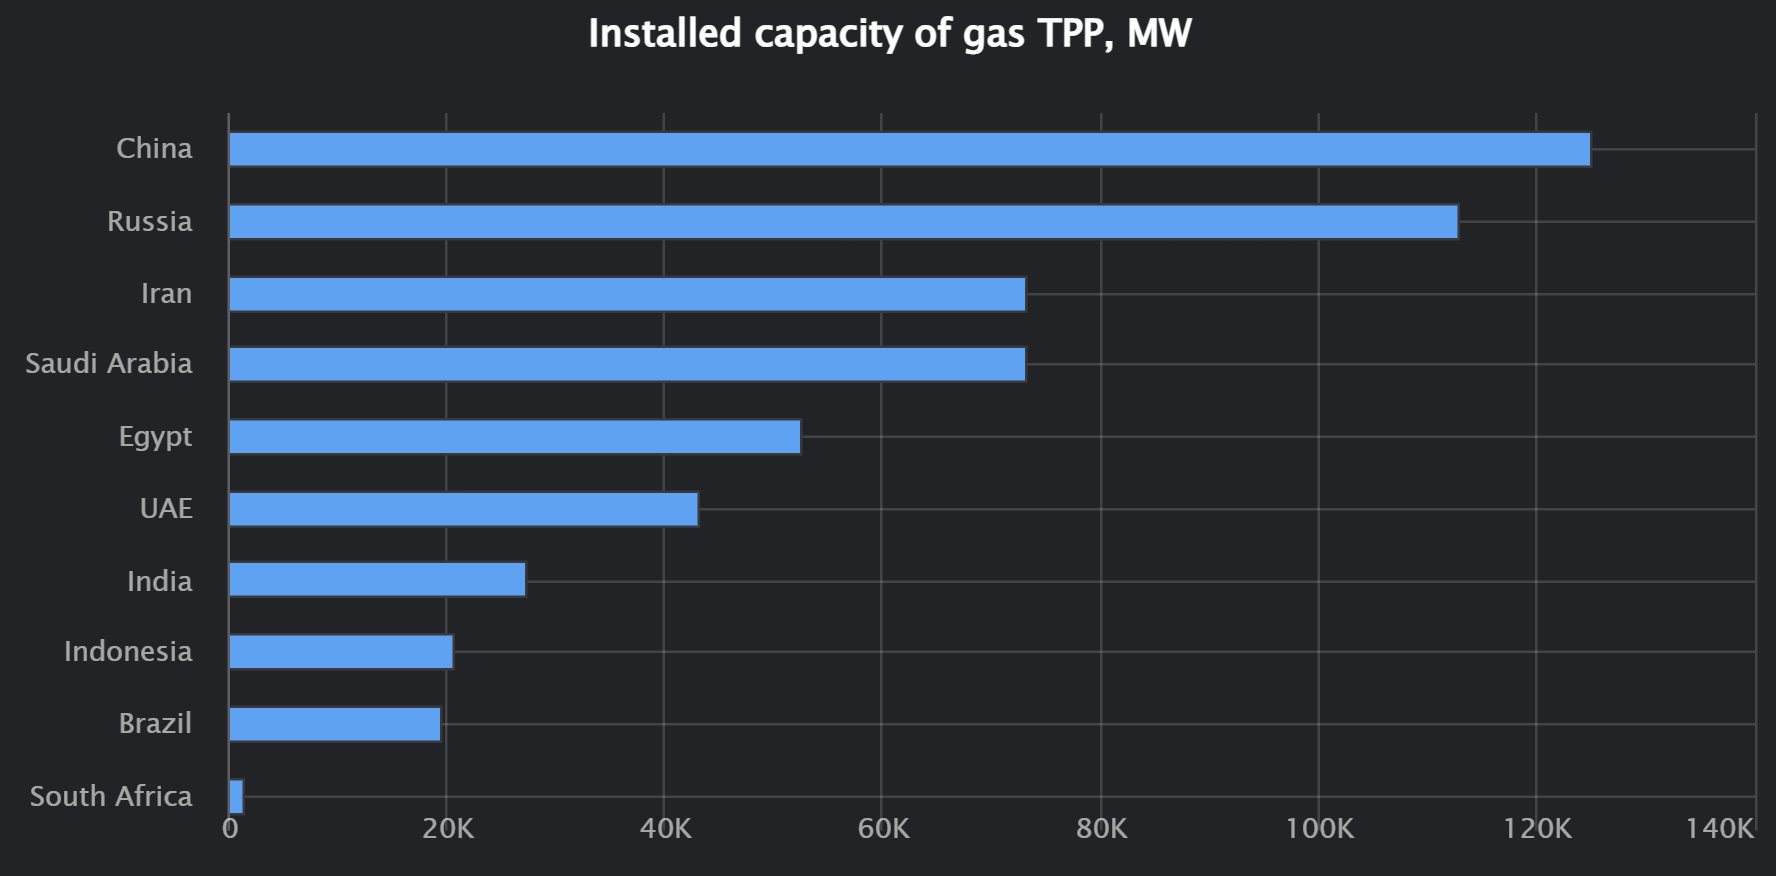
Installed capacity of gas TPP, MW
Theoretical natural gas and LNG consumption by TPP.
Gas companies
List of gas companies and search engine.