
LNG market in Q3 2025
Summary of events in Q3 2025
Geopolitics continues to be leitmotif of global LNG market in the third quarter. Current and long-term LNG markets are largely determined by the relationships between major powers and local conflicts. At the moment, market factors of global supply and demand are taking a backseat. LNG market begins to follow oil market’s trends and is being divided into Eastern and Western parts.
Arctic LNG-2 resumed commercial LNG shipments and delivered 7 shipments of LNG to China's Guangxi Beihai Terminal in Taishan Port during the quarter. Deliveries began on the eve of the September meetings of the Chinese and Russian leaders, which indicates that these deliveries are a system solution. Apparently, the Guangxi Beihai regasification terminal was sold by National Oil and Gas Pipeline Company to Novatek or a Russian trader. These LNG shipments have become an important precedent for the global LNG market - for the first time, supplies were made from a plant included in the lists of Western countries. The Koryak floating storage facility, which is also on these lists, was involved in the deliveries.
Russia and China have signed preliminary agreements on the supply of pipeline gas via the new Power of Siberia - 2 main gas pipelines and the Far Eastern route. Starting in the 2030s, these agreements will change the scheme of gas trade in Eurasia: the Russia-China direction will become the backbone stream, which will completely replace the once main global pipeline gas supply route Russia-EU.
EU lost trade war to USA. In addition to EU financing of the US national debt through additional taxes on imports of goods from the EU to the United States, Washington also forced the EU to purchase energy exclusively from the United States. The total amount of obligations exceeds the cost of energy imports to the EU. It is almost 100% likely that this will lead to the elimination of the remaining Russian LNG and pipeline gas supplies to the EU over a 1-2-year horizon.
Israel with the help of USA an Great Britain attacked Qatar on 09.09.2025 with symbolic air strike. Qatar is the number two LNG supplier, and this is likely to have consequences. Israel is self-sufficient in terms of gas and does not participate in the LNG market. However, its citizens hold leading positions in many global traders involved in the sale of Qatari LNG. Similar conflicts have already emerged in the coal market, with Colombia refusing to supply coal to Israel, leading to a conflict with Glencore, which has a strong Israeli component.
As of 13.10.2025, there were 48 LNG plants in the world with a total LNG liquefaction capacity of 504 MTPA. 10 plants were fully or partially idle with total non-operational capacity of 35 MTPA. The market is drifting towards an oversupply.
In 2025, record-breaking 56 MTPA of LNG capacity is expected to be commissioned. Next year record could be broaken - 58 MTPA is going to be commissioned in 2026. USA dominates LNG build up - 37% of capacity of projects under construction.
USA remained to be the number one LNG supplier in the third quarter. Qatar and Australia are in the top three. Russia is fourth.
As of 13.10.2025, there were 203 regasification terminals in the world with a total regasification capacity of 1069 MTPA.
Regasification capacities of 98 MTPA are expected to be commissioned this year. Y-o-Y growth is 9%. China’s share in capacity build up this year is 51%. Although many projects are delayed or even shelved. New regas projects are becoming more niche and focused on specifics of local areas.
China was leader in LNG discharge in Q3. Japan and South Korea are in second and third places respectively.
Indonesia is following Egypt’s way and moving away from exporters status. As of Q3 2025 domestic LNG consumption is already 39% of LNG production.
As of 15.10.2025, reserves of working natural gas in the UGS of EU and UK amounted to 90.5 bcm, which is equivalent to 82% filing rate. It is minimum volume for 5 years and slightly lower than recommendations of European Commission (94.0 bcm). Although EU and UK’s stocks of natural gas could be treated as sufficient ahead of gas winter taking into the account surplus of regasification terminals in Europe.
Gas reserves in Ukraine as of 15.102025 amount to 8.6 bcm. Storage utilization is 28%. Ukraine was able to slightly exceed last year's figure (8.2 billion cubic meters), but the level of reserves is the second lowest in all years. This volume is minimally sufficient for the domestic market of Ukraine in its current form, taking into account depopulation and deindustrialization.
As of 13.10.2025, there were 913 operational LNG carriers, including bunkering vessels, FSRU, floating LNG plants and floating storages with 61.5 MT of total cargo hold capacity. In 2025, LNG carriers with 7.5 MT of total cargo hold capacity are expected to be commissioned.
LNG spot price in East Asia (JKM) as of 09.10.2025 was 10.84 USD/MMBtu (-13% compared to Q2 end). Seasonal week demand and increasing liquefaction capacities are pressuring spot market prices.
Seaborne trade
LNG plants
As of 13.10.2025, there were 48 LNG plants in the world, including partially idle ones, with a total operational LNG liquefaction capacity of 504 MTPA.
10 plants were completely or partially idle with a total non-functioning capacity of 35 MTPA. List of idle plants and trains:
Marsa el Brega LNG in Libya.
Yemen LNG.
Train 1 at the Atlantic LNG plant in Trinidad and Tobago.
one of the two Gazprom LNG Portovaya’s train.
Cryogaz-Vysotsk plant in Russia
Trains C, D, E of the Botang LNG plant in Indonesia.
Darwin LNG Plant and train 2 of the Northwest Shelf LNG plant in Australia.
Damietta LNG plant and Egyptian LNG plants in Egypt. EGAS at Idku discharges rare LNG cargoes from time to time.
As of 13.10.2025 trains at 25 plants (including expansion projects for existing plants) are under construction with new liquefaction capacity of 192 MTPA (38% of current operational capacity). Such an extremely high development rate for any industry indicates the upcoming changes in the industry in the coming years, which will be negative for LNG producers.
In 2025, LNG capacity is expected to be commissioned with a total volume of 56 MPTA. Even larger volume of liquefaction capacity is expected to be commissioned next year - 58 million tons/year. The United States dominates this process - it (including the US company's project in Mexico) will account for 55% of the capacity input in 2025, and 45% in 2026.
In June, final investment decision was made on new trains 8 and 9 and debottlenecking of Stage 3 of the Corpus Christi plant. Total capacity of the new facilities will be 5.3 MPTA. Commissioning is expected in 2028.
In September, final investment decision was made on construction of Train 4 of Rio Grande LNG plant. Capacity of the train is 5.4 MTPA. Commissioning is scheduled for December 2030.
Loading
According to Seala AI, the United States remained the number one supplier of LNG to the global market in the third quarter. Qatar and Australia are in the top three. Russia is the fourth.
USA
The United States was the largest producer of LNG in Q3 2025 is guaranteed to remain so in the coming years. The US LNG industry is living its best life.
Q3 LNG shipments from the United States amounted to record-breaking 28.0 million tons. Utilization of existing by the end of the quarter capacities was huge for summer time period 94%.
Export poftfolio of US LNG was very diversified in Q3 2025. Europe is focus of supply for US LNG.
The United States continues to successfully monetize the crisis in Eastern Europe started in 2013 under Biden administration (vice president in 2009-2017, president in 2021-2025) and consequent elimination of Russian energy resources from the European market. Commissioning of US LNG plants is synchronized with the disconnections of Europe from Russian gas and LNG.
In Q3 Venture Global LNG almost completed the commissioning of the new trains of its giant Plaquemines LNG plant. As of 15.10.2025, operating capacity of the LNG plant is at 22.3 MTPA. The last train is expected to be put into operation in Q4.
In May 2025, the US Department of Energy published a study of the US gas market with the main conclusion that gas production will be sufficient for both domestic consumers and LNG exporters on the horizon until 2050. At the same time, DOE granted on 29.05.2025 export license for train 2 of Sempra’s Port Arthur LNG plant. Each train will have capacity 13.5 MTPA. This was the first case of permit issued after Biden's LNG pause.
In June, final investment decision was made on new trains 8 and 9 and debottlenecking of Stage 3 of the Corpus Christi plant. Total capacity of the new facilities will be 5.3 MPTA. Commissioning is expected in 2028.
In September, final investment decision was made on construction of Train 4 of Rio Grande LNG plant. Capacity of the train is 5.4 MTPA. Commissioning is scheduled for December 2030.
In the coming years, the balancing of the Atlantic Basin market will be managed by the United States by limitation of export of Russian pipeline gas and LNG.
Details of LNG shipment from the USA are available at the link.
Canada
Canada debuted on the LNG market on 29.06.2025. The first cargo was loaded that day onto LNG carrier Gaslog Glasgow. In July, the first train was temporarily stopped due to the need to replace some of the equipment.
Commissioning of the second 7 MTPA train began on 09.10.2025.
Two more local LNG plants are underway:
Woodfibre LNG plant near Vancouver with a capacity of 2.1 MTPA.
Cedar floating LNG plant next to Canada LNG with a capacity of 3.3 MTPA.
Q3 loadings amounted to 1.0 million tons. Cargoes were delivered to South Korea, Japan and China.
Mexico
Q3 export volumes were in line with Q2 - 252 kt.
Construction of LNG facilities is under way in Mexico - as of 15.10.2025 - 4.7 MTPA capacity is under construction, and 27.2 MTPA is planned.
Q3 2025 LNG discharge amounted to 316 kt. Overall capacity of the regasification terminals is 17.9 MTPA.
Trinidad and Tobago
Q3 2025 LNG loadings totaled 2.5 million tons. Utilization of operational capacities of the only LNG plant Atlantic LNG (11.8 MTPA without idle Line 1) amounted to 85%.
Traditionally, LNG from Trinidad and Tobago is shipped worldwide and has a diversified customer base.
Peru
Q3 2025 LNG loadings totaled 924 kt. Utilization of the only LNG plant (4.4 MTPA) was 73%.
Qatar
Q3 2025 LNG loadings at QatarEnergy LNG’s combined QatarGas and RasGas plant amounted to 20.8 million tons. Plant utilization - 108%.
Qatar's main efforts are focused on the construction and contracting of future supplies for the expansion of the QatarGas plant with a total capacity of 49 MTPA. The launch of 6 trains will be carried out sequentially in 2026-2027.
Israel carried out a rocket attack on the capital of Qatar, Doha. Qatar is the number two supplier of LNG and this is likely to have consequences. Israel is self-sufficient in terms of gas and does not participate in the LNG market. But its citizens occupy leading positions in many global traders involved in the sale of Qatari LNG. Similar conflicts have already begun in the coal market - Colombia refused to supply coal to Israel, which led to a conflict with Glencore, which has a strong Israeli component.
Earlier, European Commission due to Qatar's non-subordination to Europe (the official wording, as always in Europe, is different - due to “non-compliance with environmental norms and social standards”) announced an additional tax (formally in the form of a fine) on LNG imports from Qatar in the amount of 5% of the global revenue of Qatar Energy. Estimated amount of the payment requested by the EU for right to continue supplying Qatari gas to the block is 8 bAED / 16 bCNY / 181 bINR / 210 bRUR / 2 bUSD. In October 2025, Qatar's Minister of State for Energy and CEO of Qatar Energy, Saad bin Sharida al-Kaabi, explicitly indicated that Qatar was considering refusing to supply LNG to the EU if an attempt was made to confiscate the amount of the so-called fine.
In July, QatarEnergy began deliveries to Isle of Grain regasification terminal near London area under 25-year lease agreement for 7.2 MTPA of regasification capacity (half of the terminal's total capacity). This indicates Qatar's desire to maintain supplies to the European market and reduce dependence on the decisions of European Commission.
Details of Qatar's exports are available at the link.
UAE
Q3 2025 loadings at the only LNG plant Das Island (7.6 MTPA) amounted 1.1 million tons. Utilization was 57%.
Discharge at regasification terminal in Jebel Ali (Emirate of Dubai) amounted to 545 kt. Traditionally, discharges at this terminal peak in the third quarter of each year during the heat wave.
Emirate of Abu Dhabi keeps increasing its presence in the global LNG market. Primarily it happens via abroad M&A. Main agents of abroad presence are ADNOC and the Mubadala Investment Fund.
However, in the third quarter, ADNOC withdrew its offer to purchase Australian gas company Santos.
Final investment decision on Commonwealth LNG plant in the United States, in which ADNOC has an effective share of 24.1%, is expected to be made in the fourth quarter. This will increase the company's perspective LNG portfolio.
The second LNG plant in the country, Ruwais, is expected to be launched in 2029. The plant's capacity will be 9.6 MTPA.
Oman
Loadings at the only LNG plant (11.4 MTPA) amounted to 3.0 million tons in Q3 2025. Utilization of the design capacity was 105%.
Key importers of Q3 resource were China, Japan, Kuwait and India.
Australia
LNG plants update
Northern Australian LNG projects are facing a steady decline in gas production.
Darwin LNG plant (3.7 MTPA) has been idle since November 2023. The launch of the Barosso gas field in the second half of 2025, whose gas reserves 2P (total proven and probable reserves) are estimated at 110 bcm, will allow the restart of the Darwin LNG plant.
Train 2 of Woodside Energy’s Northwest Shelf LNG plant (2.5 MTPA) continued to be idle due to economic reasons. The launch of the second stage of development of the Waitsia gas field in the third quarter of 2025 will provide additional gas resources for the Northwest Shelf LNG plant.
The Scarborough natural gas field, located in the Carnarvon Basin, about 375 km off the coast of Western Australia, is expected to be commissioned in 2026. The development includes the installation of a semi-submersible floating production facility moored at a depth of 950 m, connected by a pipeline with a length of about 430 km to the second line of the Pluto LNG plant with a capacity of 5 million tons/year at an existing onshore facility.
Ichthys LNG plant is expected to be shut down for 51 days in Q3 2025 - from August 19 to October 9. It will reduce exports by 1.2 million tons during this period.
LNG loadings
LNG loadings at Australian plants totaled 18.7 million tons in Q3 2025. This was the lowest level for the entire observation period (starting Q4 2022). Utilization of operational capacities (excluding long-term idle) - 92%.
In Q3 2025 Australia traditionally became the number one LNG supplier to the world's three largest LNG importers, China, Japan and South Korea.
Potential Australia - China trade war
Export of LNG from Australia to China were currently interrupted in 2021-2022 due to the first Australia-China trade war.
At the same time, Australia is one of the key participants in the US anti-Chinese military alliances in Asia, including:
AUKUS (USA, UK, Australia),
Quad (USA, Australia, India, Japan),
Five Eyes (USA, UK, Canada, Australia, New Zealand).
ANZUS (USA, Australia, New Zealand),
Australia - Papua New Guinea bilateral treaty.
The numerous military alliances against China and the intensification of Australia's cooperation with other countries within the framework of these alliances in 2025 make the risk of a repeat of the Australia-China trade war and the suspension of all Australian LNG exports to China extremely high.
Details of Australia's exports are available at the link.
Papua New Guinea
Q3 2025 loadings at the country's only LNG plant (8.3 MTPA) quarter amounted to 1.7 million tons. Utilization of the design capacity was 82%.
All cargoes go to neighboring East Asian countries - China (including Taiwan), Japan and South Korea.
Brunei
Q3 2025 loadings at the only LNG plant (7.2 MTPA) amounted to 1.0 million ton. Utilization of the design capacity was 57%.
All cargoes go to neighboring East Asian countries - China (including Taiwan), Japan and South Korea.
Indonesia
LNG loadings amounted to 4.5 million tons in Q3 2025, including 208 kt of transhipment. Utilization of 22 MTPA operational capacity (excluding long-term idle) was 80%.
LNG discharge at own regasification terminals amounted to 1.7 million tons (39% of the country's production). This is a repeat of the record result of Q3 2024. Overall demand for natural gas and demand for LNG are steadily growing in this 285 million country. LNG demand growth is driven by both overall population and basic economy growth, and transition of a number of energy facilities to gas (for example, small scale power plants which were previously running using diesel fuel, general gas supply to remote, isolated areas).
Stagnant LNG production (17.7 MPTA in 2024), growing demand (6.1 MTPA in 2024) and a high level of export commitments (10.2 MTPA of mandatory export supplies as of 15.10.2025) lead to commercial shortage of LNG - there is no longer enough domestic production for own consumption and for the fulfillment of export contracts. It is expected that up to 50 shipments for export will have to be cancelled in 2025. The deficit will only grow every year.
Malaysia
LNG loadings at Malaysian plants totaled 6.1 million tons in Q3 2025. Utilization of the design capacity (32 MTPA) was 76%.
Discharge at Malaysian regas terminals amounted to 637kt (10% of domestic LNG production). Domestic demand for LNG is stable.
In October 2025, it became known that the government plans to make natural gas the main fuel of the local electric power industry by 2032 and replace coal in this capacity. Thus, the government will invest in a wide range of gas assets.
Details of Malaysia's exports are available at the link.
Russia
LNG plants loadings
LNG shipments from the plants totaled 7.2 million tons in the third quarter. This indicates 70% utilization of the design capacity of existing lines (excluding idle ones). The decrease in utilization from 111% in the second quarter was due to the launch of the first two Arctic LNG-2 lines into commercial operation and seasonal repair campaigns.
4.4 million tons were shipped from Yamal LNG (Sabetta port). Decrease in shipments was caused by traditional summer mainteinance. France, China and Belgium became key buyers of Q3 cargoes.
2.3 million tons was loaded at Sakhalin-2 (Prigorodnoye port). Most of Q3 cargoes went to Japan. Japan continues to receive so-called “permits” from the United States to import LNG from Sakhalin-2. There were also shipments to China and South Korea.
Arctic LNG-2 resumed commercial LNG shipments. 526 kt was loaded during the quarter. In September 2025, the shipment of LNG shipments from the second line of Arctic LNG-2 was confirmed. 7 cargoes were delivered to China's Guangxi Beihai Terminal in Taishan Port during the quarter. Deliveries began on the eve of the September meetings of the Chinese and Russian leaders, which indicates that these deliveries are a system solution. Apparently, the Guangxi Beihai regasification terminal was sold by National Oil and Gas Pipeline Company to Novatek or a Russian trader. These LNG shipments have become an important precedent for the global LNG market - for the first time, supplies were made from a plant included in the lists of Western countries. The Koryak floating storage facility, which is also on these lists, was involved in the deliveries.
Exports from Russia's medium-tonnage Baltic projects in Vysotsk, Leningrad Region, were halted in the first quarter of 2025 due to EU rejection and pressure on third countries from the United States.
Exports from Russia's medium-tonnage Baltic projects in Vysotsk, Leningrad Region, were halted in Q1 2025 due to EU rejection and US pressure on third countries.
Last export cargo was shipped from Gazprom LNG Portovaya on February 13. Moreover, the last two cargoes for export are still on the Pearl (formerly Pskov) and Valera LNG carriers in the Russian territorial waters of the Gulf of Finland. Since then, the plant has loaded three 76 kt cargoes to the Marshal Vasilevsky. All cargoes were delivered to Kaliningrad region of Russia. This indicates chosen tactics of the plant for the coming years: one of the trains has been shut down, the other will ship LNG cargoes using Marshal Vasilevsky approximately every 37 days with their subsequent regasification by the same Marshal Vasilevsky.
The last cargo from Cryogaz-Vysotsk left on February 17 and was delivered to Zeebrugge, Belgium. There were no shipments in the third quarter.
Piped gas export
Russia and China have signed preliminary agreements on the supply of pipeline gas via the new Power of Siberia - 2 main gas pipelines and the Far Eastern route. Starting in the 2030s, these agreements will change the scheme of gas trade in Eurasia: the Russia-China direction will become the backbone stream, which will completely replace the once main global pipeline gas supply route Russia-EU.
In October 2025, Gazprom and Kazakhstan signed a memorandum on the construction of a new main gas pipeline from Russia to Kazakhstan with initial capacity 10 bcma.
Gazprom continues to supply pipeline gas to Uzbekistan in transit through Kazakhstan under 7.7 bcma (21 mcm per day) contract. Plans for 2026 is to increase volume of supplies to 11 bcma (30 mcmc per day).
Russian gas exports continue to turn towards BRICS. However, redirecting flows will require significant time and investment.
Details of Russian gas market are available at the link.
Norway
Q3 2025 loadings at the country's only large-tonnage plant Hammerfest Snøhvit (4.2 MTPA) amounted to 593. The achieved utilization is only 28%. All of the LNG was supplied to the EU.
The low-tonnage Risivika (330 kt per yer) operated at its design capacity and provided LNG bunkering and small parcels for local consumers.
Mozambique
Q3 2025 loadings at the only LNG plant Coral South (3.4 MTPA) amounted to 923 kt. This indicates 109% utilization.
In December 2024, the final investment decision was made on Coral North floating LNG plant project. The country's second floating LNG plant with a planned capacity of 3.4 MTPA is expected to be commissioned at the end of 2027. Owners of both Coral projects are the Italian Eni, ExxonMobil from the USA, Chinese CNPC, South Korea’s the Korean Gas Corporation, UAE’s ADNOC and the local Empresa Nacional Hydrocarbons. Mozambique's share in these projects is tiny 10%. On top of this, LNG sales of ENH’s 10% share are controlled exclusively by Dutch Vitol.
Construction of Mozambique LNG Zone 1 offshore plant (13 MTPA) is frozen as of 08.07.2025. Construction was halted due to a standoff with local population. This project is 100% controlled by foreign companies from France, Japan, India and Thailand, which is probably the real reason for the discontent of local communities.
In addition, ExxonMobil’s Rovuma LNG (18 MTPA) project is under development. Final investment decision is expected in 2026. However, there is limited economic sense nowadays for US company to develop LNG project abroad and compete with domestic US LNG projects. The only exception if ExxonMobil will grab almost all profit of this project.
Thus potential Mozambique’s liquefaction capacity is up to 38 MTPA.
Angola
LNG exports from Angola are growing in 2025 due to increased gas production at Sankha field. Q3 2025 loadings amounted to record-breaking 1.2 million tons. Utilization of the only LNG plant (5.2 MTPA) amounted to 94%.
The increase in gas production at this depleted oil field has provided 2.3 mcm per day (0.8 bcm per year) of additional resource for Angola LNG. At the second stage of production improvement at this field, additional supplies to the LNG plant are expected in the amount of 6 mcm per day (2.2 bcm per year). Operational capacity of the Angola LNG plant is 5.2 MTMA, which is equivalent to 7.1 bcm per year of natural gas.
Previously, Angola LNG's main resource was associated gas from offshore oil platforms. Natural decline in oil production led to a decrease in the associated gas resource for the LNG plant. New gas consortium plans to add up to 12 mcm of gas for the LNG plant from the pure Quiluma and Maboqueiro gas fields, which will ensure full utilization of the plant and give feasibility for its expansion.
Republic of the Congo
The first floating LNG plant Tango (0.6 MTPA) continues stable shipments. 157kt were loaded in Q3 2025, which indicates 105% utilization of the plant.
On September 16, vessel “Nguya FLNG”, which was built in China for the second stage of the project, left Shanghai for the Congo. Capacity of the FLNG is 2.4 MTPA. The launch is expected in late 2025 - early 2026. The plant's resource base is the Nene Marine offshore oil and gas field, which is already operating.
Equatorial Guinea
Punta Europe floating LNG plant (3.7 MTPA) continues stable shipments. 708 kt were loaded in Q3 2025. Achieved utilization is 80%.
Cameroon
Cameroon floating LNG plant (2.4 MTPA) continues stable shipments. Q3 2025 loadings amounted 367kt, which indicates 61% utilization of the plant.
Hilli Episeyo (7382720), which is the basis of this LNG plant, will finish its work in Cameroon in December 2026 and will be moved to Argentina for a new GLNG project. In Q2 2025, the vessel was chartered for 20 years for this new project.
Nigeria
Loadings at Nigeria LNG, the only LNG plant, amounted to 3.3 million tons in Q3 2025. Utilization of the design capacity (22.2 MTPA) is 59%.
Mauritania and Senegal
In February-April 2025, the British BP commissioned the first stage of its floating LNG plant Greater Tortue Ahmeyim on the border of Mauritania and Senegal. In October 2024, BP’s British Sponsor LNG carrier delivered to the plant LNG cargo necessary for technical start-up of the plant's facilities, and in February - April, the first three small LNG parcels were produced at the plant. Commercial operation began on April 17. Combined capacity of the four trains amounts 2.5 MTPA. It is expected that commissioning will be done by end of 2025.
Q3 2025 loadings amounted to 537 kt.
Algeria
Loadings at the country's two LNG plants amounted to 1.6 million tons in Q3 2025. Utilization of design capacity (25.5 MTPA) - 25%.
The main exports of Algerian natural gas are still carried out through pipelines to Spain and Italy.
Details of Algerian exports are available at the link.
Detailed export statistics by country are available at the link.
Regasification terminals
As of 13.10.2025, there were 203 regasification terminals in the world, including terminals with temporarily unavailable FSRU, with a total regasification capacity in the amount of 1,069 MTPA.
The regasification capacity exceeds the LNG production capacity by 2.1 times. A significant part of regas terminals is designed to manage risks of local energy systems and import LNG only when necessary. List of such typical risks includes:
Increased demand during heating season. Relevant for UK, EU, Türkiye, China, Japan, and South Korea.
Increased demand during the hot season. Relevant for Egypt, the Middle East, India and Southeast Asia.
Shortage of hydroelectric power generation due to droughts. Relevant for Brazil and partly Norway.
Shortage of wind power generation on certain days and seasons. Relevant for EU.
Reserve in case of interruption of pipeline gas supplies. Relevant for EU.
A reserve in case of temporary poor environmental conditions and the need to reduce the share of coal generation for a while. Relevant for China and South Korea.
Trading companies also build regasification terminals to create the necessary infrastructure conditions for portfolio (price) optimization of gas and other fuel purchases for TPP. This approach is especially relevant for large markets such as China and EU.
Due to regas project delays the peak of commissioning of new capacities has shifted from 2024 to 2025. Regasification capacity of 98 MTPA is expected to be commissioned this year. Annual increase - 9%. China’s share in new 2025 capacities - 51%.
Many projects are delayed or even shelved. New regas projects are becoming more niche and focused on specifics of local areas.
Discharge
According to Seala AI, China once again became the leader in LNG discharge. However, quarterly discharge volumes keeps falling. Japan and South Korea are in second and third places respectively. India is feeling more and more confident itself in fourth place.
China
Mainland China
China continues to dominate in regas capacity newbuild. China continues to rely on its gas infrastructure and actively develop it. China is flexible in LNG purchases - balancing is carried out by pipeline gas, coal, and hydroelectric power plants.
As of 13.10.2025, there are 35 operating regasification terminals in China with total capacity 149 MTPA.
The year 2025 is expected to be a record year for the commissioning of regasification terminals in China. However, there is already some regional surplus of regas capacity. It led and keeps leading to low utilization levels for new and existing terminals. Practice of accelerated construction of facilities in a certain industry in China, followed by itsunderutilization, is quite common and regularly repeated in China. Therefore, the growth of regasification capacity in China will not necessarily lead to an increase in LNG imports in 2025 and beyond.
LNG deliveries to China totaled 17.1 million tons in Q3. It reverted downward trend started in Q1 2025. Utilization of regasification terminals in the third quarter was 46%.
The volume of physical re-export of LNG from China amounted to 375 kt.
It is worth noting that natural gas supplies from Russia to China via the Power of Siberia are growing every quarter. It is expected that designed capacity (38 bcm per year) will be reached in Q4 2025. In 2024, 31 bcm were delivered. Thus, in 2025, the Chinese market will have an additional 5-6 billion cubic meters of natural gas, which is equivalent to 332 kt LNG per month.
Taiwan province
Q3 2025 LNG imports amounted 5.6 million tons. It is similar to last three quarters. LNG import volumes have been stable for a long time.
Taiwanese CPC has 8 long-term SPAs with 10.9 MTPA firm import volumes (2.7 million tons per quarter).
Utilization of the regas terminals (20.0 MTPA) was 112%, the second highest in the world after Bangladesh.
In early April, after Trump administration imposed new tariffs on almost all countries, Ministry of Economic Affairs of Taiwan Province of China contacted Trump Administration with a proposal to increase US LNG purchases by two to three times in an attempt to reduce or eliminate the tariffs imposed. In 2024, Taiwan imported 2 million tons of LNG from the United States, which accounted for 10% of Taiwan's LNG purchase portfolio.
Japan
Q3 2025 discharges amounted 15.6 million tons. Up 1.2 million tons since Q2. Utilization of regas capacity (216 MTPA) was 29%. Japanese regas capacity is in excess. Excess capacity created for insuring that peak seasonal and regional demands will be met, as well as overcoming problems with nuclear and coal generation.
Largest LNG suppliers to Japan in Q3 2025:
Australia - 5.9 million tons
Malaysia - 2.2
Russia - 1.5
Japan has a very diversified supplier base - cargoes from 15 countries were delivered to Japan in Q3 2025. Many of these supply lines are controlled by Japanese oil and gas companies, including ownership of LNG carriers, shares of LNG plants and underlying gas fields.
Due to the lack of significant economic growth and slow extinction of the Japanese population, domestic gas consumption stagnates. Recommissioning of nuclear power plants that were shut down after Fukushima in 2010 has an additional impact to decrease in LNG import. However, there are delays of restart dates of power units due to regulatory issues.
Japanese gas companies are developing the trading of long-term contracted LNG volumes to third countries. This includes investing in regasification capacities in Southeast Asian countries, as well as pressure on non-Japanese owned LNG suppliers to cancel destination clause in long-term contracts. Due to huge Japanese LNG fleet and the emerging optionality in gas supply directions, it is reasonable to expect further increase in the international trading activity of leading Japanese gas companies.
South Korea
Q3 2025 LNG import totaled 11.8 million tons. Utilization of the design capacity of regas terminals (146 MTPA) is 32%.
Key Suppliers:
Australia - 4.0 million tons
Malaysia - 1.9
Qatar - 1.4
USA - 1.2
Russia - 644 kt
The structure of LNG suppliers to South Korea is very diversified and consisted of 16 countries in Q3.
Singapore
LNG deliveries to Singapore in Q3 amounted to 3.0 million tons, of which 629 kt were re-exported and approximately 164 kt were sold as a bunker.
Utilization of the regasification terminal (11 MTPA) without re-export and bunkering was 80%.
Details of the import and re-export of LNG by Singapore are available at the link.
Thailand
Gas-fired thermal power plants account for more than half of power generation in Thailand. Therefore, LNG demand strongly depends on seasonality of electricity demand and availability of cheaper sources of electricity (primarily hydroelectric power plants).
The period from March to May is the peak period in terms of electricity demand.
Q3 2025 LNG imports amounted to 2.3 million tons. It is the lowest volume since Q4 2022. Utilization of the terminals (19 MTPA) was 48%.
Bangladesh
Q3 2025 LNG imports amounted to record-breaking 2.1 million tons. Utilization of rwo FSRUs (7.5 MTPA) is high 114%. Bangladesh is a promising market for new LNG exporters - fast growing population and energy demand of this 176 million country can consume many times more LNG in the near future.
India
Q3 2025 LNG imports totaled 5.4 million tons. Utilization of the design capacity of the terminals (51.5 MTPA) was 42%.
Qatar continues to be the leading supplier of LNG to India and accounts for almost half of Indian LNG market. USA - 2, Angola - 3, Nigeria - 4.
It is worth noting the statement made by the Indian Minister of Energy while visiting USA that India will not import LNG from the Arctic LNG-2 project due to threats from the United States. The success story of Russian offshore oil exports, where India has become the dominant buyer of redirected supplies, has not been repeated with Russian LNG yet.
In early October, it became known that Gazprom was negotiating the construction of a regasification terminal in India. The construction of the terminal is being considered at Kakinada port on the east coast of India. The terminal's capacity is 5 million tons of LNG per year. The volume of investments is 50 billion rubles. This terminal can become both the anchor recipient of LNG from the new LNG plant in Ust-Luga, and the recipient of LNG from Sakhalin-2 in case Japan abandons it.
Pakistan
Main consumers of LNG in the country is gas-fired thermal power plants. Gas-fired thermal power plants compete in generation stack with sun power plants, which are being actively developed. As of 03.07.2025, Pakistan has 14.7 GW gas-fired TPP. This is equivalent to 23 MTPA in case of base loading, excluding repairs. 2024 LNG import volume amounted 8.2 million tons.
Pakistan has a population of 242 million people. Economic growth rate is 3.2% (of which 1.6% is due to population growth). The territory of Pakistan is poor in terms of hydrocarbons reserves. Pakistan has huge potential for LNG and pipeline gas imports in the future. Per capita energy consumption remains at a very low level and has a high potential for growth. But the poverty of the population and high risks for infrastructure projects hinder the growth of LNG imports.
Pakistan subsidizes domestic gas and electricity prices. Under IMF pressure Government of Pakistan raised in 2025 gas and electricity prices in order to reduce budget expenditures. This is expected to reduce the demand for electricity. In addition, this will reduce the demand for LNG imports in H2 2025 and beyond, with an additional impact from the growth of installed SPP capacity and economic prioritization of coal-fired generation over gas-fired.
Q3 2025 discharges amounted 1.9 million tons. Utilization of two operating terminals (10.5 MTPA) was 72%.
All cargoes in Q3 came from Qatar. Pakistan has two long-term contracts with Qatar for the supply of 5.7 MTPA (1.4 million ton per quarter).
There is also a long-term contract with Eni for the supply of 700 kt per year (175 kt per quarter).
There are reports of delays in payments by Pakistani companies for already delivered LNG cargoes. However, it is unlikely that this will be a constraint for Qatar Energy due to Qatar's interest in strong bilateral relations with Pakistan.
In September 2025, Pakistani LNG importers Pakistan State Oil Company (PSO) and Sui Northern Gas Pipelines Limited (SNGPL) requested QatarEnergy’s consent to reduce the number of cargoes under existing SPA. These companies presented the Qatari exporter four options for rationalizing LNG supplies due to limited flexibility under existing contracts. This step was taken due to t oversupply of regasified liquefied natural gas at domestic marker caused by a decrease in demand from private and energy consumers. A decrease in demand, especially from gas TPPs, after an increase in fixed tariffs and the introduction of autonomous fees, led to a surplus of natural gas on the market. It is predicted that between July 2025 and 2031, about 177 LNG cargoes will remain surplus.
In October 2025, it was reported that Pakistan plans to cancel 24 shipments of LNG from Qatar in 2026.
Iran
In June 2025, Iran successfully launched the fourth gas purification complex at the 14th phase of the South Pars gas field. Iran's gas production continues to grow rapidly. On top of this Iranians build new facilities using their own technological and financial resources.
Gas supplies from Iran to Iraq under contract signed in March 2024 (up to 55 mcm per day) decreased to 25 mcmc per day in April - August.
Iraq
The decline in gas supplies from Iran to Iraq has led to difficulties for Iraq's energy system in the third quarter of 2025.
Iraqi authorities tried to find a FSRU to cover Q3 peak consumption, but were unable to do so.
Iraq also tried to transit Turkmen gas through Iran (5 bcma, 14 mcm per day). However, the United States blocked this delivery. Earlier in the second quarter, the United States tried to block the supply of Iranian gas directly to Iraq. De facto, the United States is organizing an energy blockade of Iraq's population and industry by the Iraqi government, obediently following restrictions from Washington.
Kuwait
Q3 2025 discharge volume amounted to 3.0 million tons. At the level of the third quarters of the previous two years. Traditionally, the third quarter is the period with the highest volume of LNG imports to Kuwait due to high demand for gas generation. Utilization of the only regas terminal (11.3 MTPA) was 106%.
1.7 million tons of LNG were supplied from Qatar (market share - 59%). The remaining shipments were supplied from Nigeria, Oman, the USA, Mozambique, and Angola.
Bahrain
In mid-April, the regasification terminal in Bahrain resumed operations after being idle since 2019.
Q3 import volumes amounted to 385 kt. Cargoes were delivered from USA, Qatar and Australia.
Egypt
Natural gas balance
Growing demand for gas coupled with shrinking domestic natural gas production, has moved Egypt from an LNG exporter to an LNG importer. As of March 2025, production stands at 117 mcm per day and is falling rapidly (a 35% drop over the year). In 2023-2024, rolling power outages were carried out due to gas shortages.
In August 2025, contract was signed for supply of natural gas from Israeli offshore field Leviathan to Egyptian gas transportation system. Deliveries will begin on 01.01.2026 and its volume will amount to 20 bcma (55 mcm per day). It will extend current gas supplies from Israel via the Arish-Ashkelon gas pipeline with a volume of 26 mcmc per day.
Such sharp transition from exporter to importer, especially given the need to spend money first on the construction of liquefaction plants, and then regasification terminals, indicates poor strategic planning of the country's energy policy.
LNG production
Both of the country's LNG plants, Damietta LNG and Egyptian LNG, are idle due to lack of resource. Only two cargos with total amount 150 kt were shipped in Q3 2025.
LNG import
To meet the demand for gas, Egypt is actively leasing FSRUs. Location of FSRUs:
Ain Sukhna is key port for LNG discharge.
Damietta has started regasification in June 2025.
The main Egyptian regasification hub has been formed in Ain Sukhna: FSRU Höegh Galleon since 2015, FSRU Energos Power and Energos Eskimo since the summer of 2025, FSRU Höegh Gandria starting November 2026.
Earlier in 2022-2025, Egypt used Aqaba industrial port in neighboring Jordan to regasify some LNG shipments. Starting in the summer of 2025, FSRU Energos Eskimo moved from Jordan’s shore to Egyptian.
In June-November 2025, Ertugrul Gazi will be leased from Türkiye for a short-term lease. This is an interesting attempt to use a single FSRU to meet peak demand at different times and locations: heat period in June-September in Egypt, heating period in December-February in Turkey.
Q3 2025 LNG discharges amounted to 3.5 million tons of LNG. It is more than two times higher than previous record.
At the moment, LNG supplies are carried out under spot contracts. The Egyptian Government is considering the possibility of concluding long-term contracts. Start of supplies from Leviathan (equivalent to 1.25 million tons of LNG per month) sill temporarily ease the problem.
Egyptian LNG market is extremely interesting for Russia. Potential import of Russian LNG to Egypt can be roughly estimated at 3 million tons per year (50% of the current volume of LNG imports to Egypt). This route is convenient for the Baltic projects, the Murmansk Plant, and western NSR supplies from Yamal LNG and Arctic LNG-2 as a replacement for the European market.
Türkiye
In June 2025, the Turkish state-owned company BOTAŞ announced completion of the construction of an export pipeline to Syria. Türkiye continues economic integration of Syria within the framework of its Turan policy. The border point of gas supply is Yavuzlu/7000. The pipeline's capacity is 6 mcm per day.
Q3 2025 discharge amounted to 849 kt. Traditionally, Türkiye actively imports LNG only during the cold months from November to March.
EU and UK
Pipeline gas import
For Russophobic reasons, the European Commission requires all EU countries, as well as states planning to join EU, to begin terminating gas supply agreements with Gazprom Export. In Q2 2025 the European Commission presented the following action plan:
Self-restriction of EU countries on conclusion of new supply agreements for pipeline gas and LNG starting from 01.01.2026.
“Termination” of short-term agreements by 17.06.2026.
“Termination“ of long-term agreements tby 01.01.2028 for all EU countries except Slovakia and Hungary.
As of 15.10.2026, this plan has not been agreed.
Since January 2025, Turkish Stream has been the only Russian gas supply channel to EU. In H1 2025, Russian supplies to EU via this route (including re-export of gas outside the EU) amounted to 43 mcm per day, which is 10% of 2021 import volumes. Of these, 21 mcm per day goes to Hungary, 7 - to Slovakia, 15 - to Serbia (including re-exports to non-EU Balkan countries), and 1 - to Greece. Some of physical molecules of Russian gas are likely to enter Ukraine from Hungary and Slovakia as part of Ukraine's commercial imports of European gas.
According to the terms of the agreements, European companies must pay fines for non-taking of gas (take-or-pay clause). The European Commission does not want to pay fines and is looking for ways to sign some kind of paper, according to which unilateral termination of international agreements without penaltieswill be considered “legitimate” in EU. Pocket Stockholm Arbitration Court is likely to be involved in this process. There is already the precedent for “legitimizing” termination of similar contract between Ukraine and Russia without paying contract amount of penalties by Ukraine. This process will finally disconnect EU gas market from supplies from Russia, which will bring additional losses to EU companies and residents and lead to continued stagnation of energy-intensive industries in EU. Even more damage will be carried on by Gazprom. It was gas sales to EU that ensured low level of domestic gas tariffs, as well as Gazprom's generous social program.
In July 2025, Greek DEPA (ΔΕΠΑ) concluded a pre-trial agreement with Gazprom Export regarding the retrospective revision of the supply price under the current gas supply agreement.The agreement was signed in January 2022 and is valid until the end of 2026. The annual volume of supplies under the current agreement is 2 bcm (5 mcm per day). The agreement contains the ”take or pay" clause. The formula price has a basic reference to the TTF index (80% of the price) and crude oil quotations (20%).
Gas stocks at UGS
Gas reserves are a key indicator of the balance of the European gas market. The compliance of gas reserves with the target level determines the necessary rates of their replenishment and general price level.
Since June 2022, the target level of gas reserves in EU’s UGS has been determined mostly by the European Commission (Gas storage regulation). Some countries also have additional national requirements set by local governments.
Storage practices in Europe has undergone major changes lately. UGSs now are playing much more important role in ensuring meeting winter peak demand due to lower volumes of pipeline gas incoming to European market. Seasonality is becoming more and more evident in this market. The accumulated reserves at the beginning of the gas winter are getting bigger and bigger every year, however, the rate of gas consumption during the gas winter is also breaking records every year.
According to the current version of the regulations as of 02.07.2025, the following basic standards apply for target reserves: the peak level of active gas reserves in the period from October 1 to December 1 should be 90% of the total storage capacity of national UGSs. There is also a threshold of 5% of allowable deviation from the target. As of 02.07.2025, this corresponds to 92.7 bcm in the EU’s UGS (85% of 109 bcm active capacity) plus 1.5 bcm in UK’s UGS. In total, 94 billion in the period from the 274th to the 335th day of the year (see graph at the top).
As of 15.10.2025, reserves of working natural gas in the UGS of EU and UK amounted to 90.5 bcm, which is equivalent to 82% filing rate. It is minimum volume for 5 years and slightly lower than recommendations of European Commission. Although EU and UK’s stocks of natural gas could be treated as sufficient ahead of gas winter taking into the account surplus of regas terminals in Europe.
Net gas injection into UGS in Q3 2025 amounted to 28.4 bcm, which is equivalent to 9.5 bcm per month or 7.1 million tons of LNG per month, on average. Q3 net injections were with the same rate as in Q2.
The required replenishment rates determine the LNG import plan. Since 2022, LNG (primarily from the United States) has been the balancing resource of the European gas market and has replaced Gazprom’s piped gas in this regard.
LNG import
The largest discharges in Q3 2025:
Netherlands - 4.8 million tons.
France - 4.4.
Spain - 3.8.
External LNG imports to EU and UK, excluding regional cabotage, totaled 24.6 million tons in Q3 2025, which is equivalent to an average of 8.2 million tons per month. Thus 87% of LNG imports in Q3 were in a way pumped into UGS facilities in preparation for the gas winter.
LNG imports to Europe decreased by 5.6 million tons compared to Q2 2025 This was largely due to the internal confidence of gas companies and national EU governments in the sufficiency of gas reserves in underground storage facilities below the recommendations of the European Commission.
In the third quarter, the United States continued to be the leading supplier of LNG to Europe - 15.6 million tons, at the level of the previous quarter. The overall decrease in LNG imports to the EU did not lead to a decrease in supplies from the United States. The U.S. share of foreign imports increased from 56% to 63%.This can be considered a characteristic and repeatable reaction of the European LNG market in the future. Trump's position is to increase the US share up to 100% as new LNG projects are launched in the US and put the EU and the UK under full energy dependence on the US.
Russia took the second place in the third quarter, but the volume decreased from 4.4 million tons in the second quarter to 2.9 million tons. This is largely due to the ban on transshipment and re-export of Russian LNG in EU ports. Russia's current share in the EU LNG market is 12%.
Qatar continued to be the number three in the ranking of LNG suppliers to the EU and the UK in the third quarter with a volume of 1.5 million tons (minus 1.0 million tons for the quarter) and a share of 6%. Qatar is consistently increasing its penetration into the European gas market, including long-term lease of regasification facilities. Qatar Energy aims at controling of supply chain from natural gas well to wholesale gas markets in North-Western Europe.
Regas terminals
As of 15.10.2025, there are 41 terminals in EU and UK with a combined regasification capacity of 210 MTPA, which is equivalent to 17.5 million tons per month. Terminals’ utilization was 48% in Q3.
Current capacity of the regasification terminals in Germany is 18.8 MTPA, which is equivalent to 1.6 million tons per month. At the same time, maximum volume of LNG imports in Germany was reached this June and amounted 964 kt (utilization rate of 60%). Germany is facing an oversupply of regasification capacity. Moreover it is relatively expensive FSRUs.
On 16.05.2025, the second FSRU (Excelsior, 9239616) began operating in the German port of Wilhelmshaven. It is planned that 1.9 bcm of gas will be delivered through this terminal in 2025. Plan for 2026-2027 is 4.6 bcm per year.
The first FSRU in Wilhelmshaven (Höegh Esperanza, 9780354) started operations in December 2022. All the LNG supplied to the terminal is from the USA.
At the same time, Egypt leased one of the idle German FSRU located in the port of Sassnitz (formerly Mukran).
Details of LNG imports by EU countries are available at the link.
Ukraine
Since 2025, the Ukrainian gas market has completed its strategic integration to the EU gas market and has become a part of it.
Domestic gas production in Ukraine has been declining almost every year since 1992. The rate of decline in production is about 1-3% per year, on average. The estimated production in 2025 (January-August) is 47 mcm per day.
In early October, Ukraine began to experience a decrease in natural gas production due to failure of production facilities in Kharkov and Poltava regions. According to market rumors, current decrease in production is approximately 60% (~28 mcm per day). A significant part of these production losses will be compensated within 2-6 months.
Ukraine's domestic gas consumption is rapidly declining: in 1992 it was 113 bcm (310 mcm per day), in 2000 it was 73 bcm, in 2010 it was 58 bcm, and in 2020 it was 31 bcm. In 2025, consumption is estimated to be around 19-22 bcm (52-60 mcm per day).
The natural gas market is in short supply. Starting in 2025, the shortage will be made up for by LNG from the United States, imported through terminals in Poland and Greece, and Russian gas purchased at hubs in Central Europe.
On 01.07.2025, the operators of the gas transmission systems of Ukraine and Poland (OGTSU and Gaz-Systems, respectively) extended the agreement on guaranteed for Ukraine capacity until 30.09.2026. Moreover guaranteed capacity increased to 12.4 mcm per day (4.5 bcm per year). The Polish route de facto receives regasified LNG from the USA at the Swinoujscie terminal. Polish Orlen is a commercial intermediary, buying LNG from USA on its own account and reselling it to Ukraine (DTEK and Naftogaz).
Gas reserves as of 15.10.2025 amount to 8.6 bcm. Storage utilization is 28%. Ukraine was able to slightly exceed last year's figure (8.2 billion cubic meters), but the level of reserves is the second lowest in all years. This volume is minimally sufficient for the domestic market of Ukraine in its current form, taking into account depopulation and deindustrialization.
Brazil
Brazil's LNG regas infrastructure consists of 8 terminals with a total capacity of 36 MTPA. LNG traditionally performs reserving function and insures the country's gas-fired TPPs are well supplied by gas during periods of low domestic hydro generation. Hydroelectric power plants accounted for 56% of the country's electricity generation in 2024. 24% was generated by WPP and SPP.
Q3 2025 LNG imports to Brazil amounted to 694 thousand tons. Terminal utilization is a meager 8%.
LNG import needs are estimated at 2.4 MTPA. At the same time, there are long-term obligations to import LNG under contracts with NewFortress, BP, Centrica, TotalEnrgies, Golden Pass LMG with a total volume of 2.8 MTPA.
Detailed import statistics by country are available at the link.
LNG bunkering
Singapore, Rotterdam and starting this year Shanghai and Shenzhen are the leading LNG bunkering centers in the world.
In Singapore, sales of LNG as bunker fuel in July-August 2025 amounted to 109 kt (44kt per month 2025 YTD).
In April 2025, the Maritime and Port Authority of Singapore announced plans to increase the volume of LNG bunker sales to 3 million tons in 2028 (250 kt per month). Thus, a sixfold increase in volumes is planned compared to 460 kt in 2024. Issuing new licenses for LNG bunkering and the construction of the second LNG terminal in Singapore are underway to achieve this goal.
Learn more about Singapore's LNG industry here.
In Rotterdam, 85 kt LNG were sold as bunker fuel in Q2 (33 kt per month 2025 YTD).
In Shanghai, bunkering volumes in H1 2025 increased by 58% YoY and amounted to 173 kt (29 kt per month). Shanghai International Port Group has ordered construction of another bunkering vessel, which will begin operations in the first half of 2027. This will double the volume of LNG bunkering operations at the port.
Bunkering in Shenzhen in H1 2025 amounted to 140 kt (23 kt per month). The growth since the first half of 2024 was 160%.

Huaihe Nengyuan Qihang LNG bunker vessel
Also, significant volumes of LNG bunker are sold in Barcelona (Spain), Zeebrugge (Belgium), Tananger (Norway), Klaipeda (Lithuania), Inku (Finland), Long Beach (USA), in other US ports, in ports of South Korea and Japan.

Map of the location of 43 operating LNG bunkers as of 10.10.2025
In Q3 the only Russian LNG bunkering vessel Dmitry Mendeleev left its region of operation in the Gulf of Finland towards Russian Far East.
Expert Alexander Klimentyev provides the following explanation of possible causes:
Cost of LNG bunker supplied from Dmitry Mendeleev for domestic bound-vessel is significantly higher than retail prices for cryogas stations in Russia. Rosmorport has found an alternative in the form of refueling vessels using tanker trucks. It is inline with regional practice - ferries on the Tallinn-Helsinki line are refueled only in this way. Thus, over the years, Dmitry Mendeleev has not been able to provide the necessary savings for domestic consumers.
For abroad-bound vessels there were obvious advantages in bunkering costs only in 2024. In 2023 and 2025, services from Dmitry Mendeleev were often and for long periods more expensive than buying LNG in Rotterdam.
Fleet
Current fleet
As of 13.10.2025, there were 913 operational LNG carriers, including bunkering vessels, FSRU, floating LNG plants and floating storages with 61.7 MT of total cargo hold capacity.
Newbuild
In 2025, LNG carriers with 7.5 MT of total cargo hold capacity are expected to be commissioned. It will be record-breaking volume. Y-o-Y increase is 53%.
South Korea is the leader in LNG shipbuilding. Japan, historic leader in the construction of gas carriers, systematically stopped their construction for internal economic reasons. South Korea has won this competition and currently dominates among existing fleet and among LNG vessel under construction.
China pursue South Korea, moving from building relatively cheap oil tankers and bulk carriers to building much more expensive LNG carriers. China is the number two shipbuilder of LNG carriers right now with a dynamically growing market share. Prospects of Chinese shipbuilding are limitless.
Russia creates its own independent capacities for LNG carriers build up. This is the only remaining option against the background of the refusal of shipyards in South Korea and China to build gas carriers for Novatek. The key asset is the Shipbuilding Complex Zvezda in Primorsky krai. The task is complicated by the fact that you need to build not only a LNG carrier itself, but also domestically produce all vessel and LNG equipment components. No country has yet solved this problem.
Secondary market
Observed secondary market of LNG carriers in Q3 (July - August data as of now) was limited to one transaction. A LNG carrier (2004, 83 kt DWT) was sold for 1.6 bRUB / 73mAED / 1.8 bINR / 144 mCNY / 20 mUSD.
Demolition
There weren’t records of LNG carries demolition in Q3. There were three such cases in the first quarter.
Freight rates
In Q3 freight rates for LNG carriers were higher than in Q2. As of 10.10.2025, freight rate was 23.3 kUSD per day for a standard modern two strokes LNG carrier with capacity of 73 ktons of LNG in the Pacific and Indian oceans.
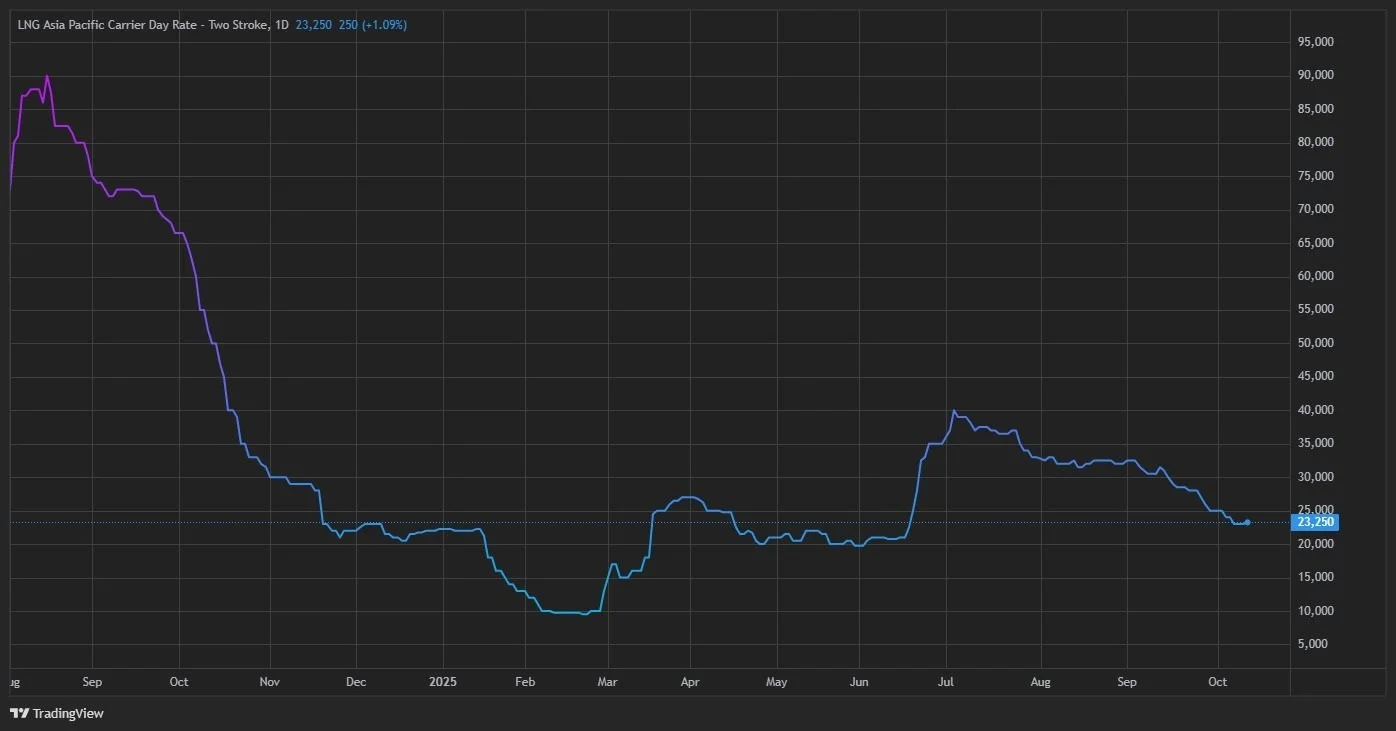
Spot freight rate of an two stroke (ME-GI, X-DF, ME-GA) LNG carrier with 73 kt capacity in Pacific and Indian Ocean region in September 2024 - October 2025, USD /day
Operating expenses for the maintenance of gas carriers can be estimated at 1.2 mRUB / 52.8 kAED / 103 kCNY/ 1.2 mINR /14.4 kUSD per day for a new gas carrier - 1.5 mRUB / 63 kAED / 123 kCNY /1.5 mINR / 17.2 kUSD for a 20-year-old gas carrier with a standard load capacity of 150-170 thousand cubic meters.
Owners of modern gas carriers (two-strokes) earn good operating margin. Owners of gas carriers built using old technologies (TFDE) earn almost nothing taking into account lower freight rates (11 kUSD / day as of 09.10.2025).
However, over the long-term horizon, owning a fleet of gas carriers is increasingly becoming more useful for LNG plant owners to operationally control its export than for independent shipping companies to make a profit.
US attack on Chinese shuipbuiding industry
One of the first attacks of the second Trump administration was aimed at curbing Chinese shipbuilding industry and simultaneous support of almost extinct US shipbuilding. This pressure could cause huge problems for Chinese economy with high multiplication effect on the whole Chinese economy. At the same time, it is unlikely that the US shipbuilders will win anything in this battle. South Korea will be clearly beneficiary and will raise the price tag for its new LNG carriers.
In the first quarter, the United States imposed an additional duty for the port entry of LNG carriers built in China and/or flying the Chinese flag. In April application of this duty has been revised regarding LNG carriers and some other vessels. Key change relevant of LNG industry that application of additional port duty for China-related LNG carriers postponed to 14.10.2028.
Potential amount of postponed till 2028 duty is estimated as follows: 140 USD (2028 amount) per net ton of LNG carrier, build in China . Capped at 5 portcall per year for each vessel. It is equivalent 375 mRUB / 17.5 mAED / 34.1 mCNY / 409 mINR /4.8 USD per portcall for standard 73kt LNG carrier.
Starting 2028 this amount will be applicable both to Chinese-owned or operated carriers, and other as well. Presumably there will be some exemptions for US-flagged or owned by US company LNG carriers, which were built in China. In addition it is announces that companies could recieve duty refund in case they will order a US-built LNG carrier. But it does not exist.
In addition starting 17.04.2029, the share of US LNG exports required to be transported on US-built, US-flagged, and US-operated vessels will gradually increase each year, from 1% in the first two years to 15% by April 2047. These restrictions will increase incrementally over 22 years.
5% of the current fleet of LNG carriers was built in China. 25% of LNG carriers under constrution are being built in China.
As of 01.07.2025, 42 gas carriers are flying the Chinese flags, including 35 gas carriers flying Hong Kong flag.
In October 2025, China introduced reciprocal additional port fees for vessels owned by U.S. individuals and operated by organizations where U.S. citizens directly or indirectly hold at least 25% of the shares. This measure applies to both U.S.-flagged carriers and vessels built in the United States. The port fees were implemented on October 14, 2025. Fees will initially be charged at a rate of 400 yuan ($56 at the current exchange rate of the People's Bank of China) per net registered ton. It is equivalent 152 mRUB / 7.0 mAED / 13.6 mCNY / 168 mINR / 1.9 USD per portcall for standard 73kt LNG carrier. Starting from 17.04.2026, the fee will be increased to 640 yuan, then from 17.04.2027 it will be increased to 880 yuan, and finally starting 17.04.2028 to 1,120 yuan.
The consequences for the LNG market depend on the overall outcome of the US-Russia and US-China confrontations and effectiveness of Russia-China cooperation. It is difficult to predict these consequences, but we will try to do it a form of extreme scenarios:
The scenario of “Splitting the LNG trade into parts“. In this scenario, China, losing the US market for direct supply of its products of a wide range, integrates more with friendly and neutral countries for it (CIS, Africa, Latin America). In terms of LNG, this means China abandoning LNG supplies from the United States and refocusing on LNG supplies from Russia while maximizing pipeline gas flows from Central Asia and Myanmar. In this case, Russian gas companies find both a sales market and solve all problems with the payment and maintenance of the fleet of gas carriers. USA will is increase LNG supplies to EU, UK, Japan and South Korea.
The “US victory in the trade war" scenario. In this scenario, China increases LNG imports from the United States, similar to the results of Trump's first trade war against China. Imports of LNG from Russia are likely to decrease, as well as the provision of technical services and equipment supplies by Chinese companies to Russian contractors in the LNG industry. The LNG market remains unified, but without Russia's participation in it.
Price dynamics
Asia
LNG spot price in East Asia (JKM) as of 09.10.2025 was 10.84 USD/MMBtu, which is equivalent to 32.3 RUR / 1.46 AED / 2.82 CNY / 33.00 INR / 39.7 US cents per cubic meter of natural gas.. Seasonal week demand and increasing liquefaction capacities are pressuring spot market prices (-13% compared to Q2 end).
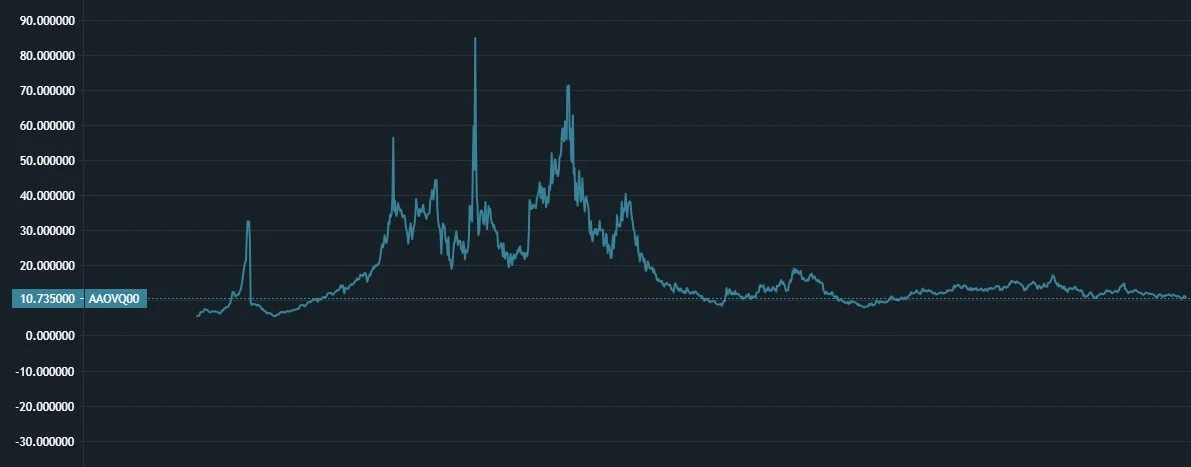
Price quotes for spot shipments of LNG to ports in Japan, South Korea and Taiwan Province of China (JKM) in October 2020 - October 2025, USD/MMBtu
From a long-term perspective, spot LNG prices have remained relatively stable over the past two years.
Wholesale LNG prices at the port of the importing country do not include the costs of regasification, distribution to the end user, taxes, fees and profits of gas companies. Energy in Japan, South Korea, and Taiwan continues to be very expensive.
Q4 quotes are at about the spot price level (slight increase of 2%).
Long-term LNG futures prices on the Singapore Stock Exchange suggest a decline in the price of LNG starting in the summer of 2028. During Q3 long-term futures declined in line with spot price decrease. Current long-term futures quotes as of 09.10.2025:
2026 - 10.70 dollars per million British thermal units (quote on 08.01.2025 - 12.55, on 08.04.2025 - 11.95, on 04.07.2025 - 12.30).
2027 - 10.30 dollars per million British thermal units (quote on 08.01.2025 - 10.45, on 08.04.2025 - 10.28, on 10.07.2025 - 11.32). A decrease of 8% from the current spot price.
2028 - 9.48 dollars per million British thermal units (quote on 08.01.2025 - 9.00, on 08.04.2025 - 9.23, on 10.07.2025 - 10.18). A decrease of 18% from the current spot price.
Despite the fact that trading in these long-term futures is not very liquid, it reflects the market's opinion about the LNG surplus during these time periods.
EU
Spot gas price in the EU (TTF) as of 10.10.2025 was 381 USD per thousand cubic meters, which is equivalent to 30.96 RUB / 1.40 AED / 2.71 CNY / 31.67 INR / 38.1 US cents per cubic meter of natural gas. Decrease from this year high 620 USD per thousand cubic meters (as of mid-February), is 39%.

Exchange prices for gas at the TTF hub (Netherlands) in 2023-2025, dollars per thousand cubic meters
European gas prices continue to be high. Voluntary self-ban on import of cheap Russian piped gas to EU is leading to transfer of energy-intensive industries, primarily chemical ones, from Europe to the United States and the Middle East, as well as increased global competition from Chinese manufacturers, who continue to massively introduce gas processing facilities.
Russia
Settlement of the National exchange index of natural gas for July 2025 delivery on the Petersburg Exchange (formerly the St. Petersburg International Mercantile Exchange, SPIMEX) was 5.9 RUB / 0.27 AED / 0.52 CNY / 6.03 INR / 7.3 US cents per cubic meter of natural gas.
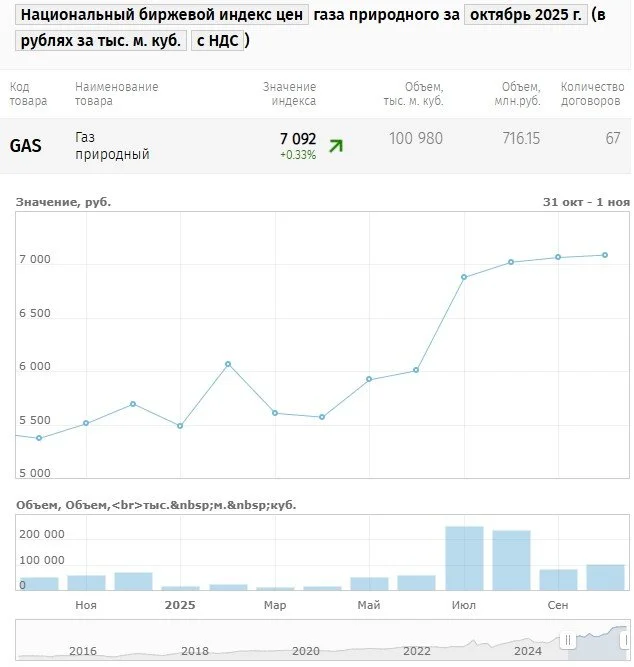
National exchange index of natural gas, RUB / thousand cubic meters including VAT
Q3 exchange traded volumed amounted to 3.9 bcm at par with H1 2025 average. Exchange-traded volumes are equal to 3% of domestic consumption of natural gas. There is huge potential of increasing share of gas sold via the exchange.
Regulated domestic residential prices increased on 01.07.2025. 2025 H2 weighted average price will be 8.32 RUB / 0.39 AED / 0.76 CNY / 8.99 INR / 10.6 US cents per cubic. The growth in rubble equivalent is 10.3%. The growth of industry and power generation domestic gas prices is 21.3%. It equalizes residential and industry prices. Earlier, in 2023-2024, a less significant growth was planned for 2025 price renewal - only 8%. Thus, this price increase was higher tha originally planned. It is worth noting that the inflation target set by Central Bank of Russian is 4%. The key rate as of 10.10.2025 is 17%. Higher gas prices will delay achievement of the inflation target.
Domestic gas marker prices and cost of Russian LNG exports aren’t linked as of now. Gas production, liquefaction and export at Yamal LNG and Sakhalin Energy plants are independent of Gazprom's Unified Pipeline Network. Only plants consuming network gas are medium-tonnage plants Cryogaz-Vysotsk and Gazprom LNG Portovaya, which have practically suspended LNG production and consumption of network gas (annual consumption at the current rate of operation is less than half bcma).
USA
Wholesale gas prices in the United States continue to be among the lowest in the world. November 2025 Henry Hab price as of 09.10.2025 was 3.28 USD/mmBTU, which is equivalent to 9.75 RUR / 0.44 AED / 0.85 CNY / 9.98 INR / 12.0 US cents per cubic meter of natural gas. No QoQ change.
Taking into account the pace of commissioning of LNG projects on Mexican Gulf coast and the political pressure of the United States on its competitors in this market, pricing in the LNG market is switching to the following formula: <wholesale price of gas in the United States> + <payment for transportation and supply of gas to the LNG plant> + <fee for gas liquefaction> + <freight to the consumer>. As of 09.10.2025, this half of the LNG price in East Asia can be estimated at 8.5 USD/MMBTU. It is this formula price that will be the asymptote for futures prices.
Market view for Q4 2025
In the forth quarter, primary consumption of natural gas in traditional LNG markets will seasonally
EU has formed sufficient gas reserves in UGS. There will be no surprises in the fourth quarter in terms of unexpected high demand for LNG from the EU.
Trump could add a new shock to the LNG market any time. It includes new initiatives on so-called “reciprocal” tariffs (it is happening right now), new wars (against Iran, Venezuela or some other countries), and the beginning of a new round of pressure on Russia, China and Iran.
Final investment decisions on new LNG facilities in the United States are expected in the fourth quarter: the fifth train of the Rio Grande LNG plant and the Commonwealth LNG plant. Overall new capacity is amounted to 13.8 MTPA.
Spot DES LNG price is expected to remained in Q4 in current 10.5-12.0 USD / MMBtu.
Notes:
Join Seala AI’s Linkedin page to be informed for all new future releases with new dashboards and insights.
Non-mainstream oil and gas news and views are available in Seala AI’s telegram channel.
Full set of reports for each country and much more information are available via Seala AI terminal.