
LNG market in Q4 2025
Summary of events in Q4 2025
Geopolitics continues to be leitmotif of global gas market in Q4. Spot and long-term LNG markets are largely determined by relationships between major powers and by local conflicts. At the moment, market factors of global supply and demand are taking a backseat. LNG market begins to follow oil market’s trends and is being slowly divided into Eastern and Western parts.
Sovereign exports of Russian LNG is slowly expanding. In December, the first LNG cargo was delivered from medium-tonnage LNG plant Gazprom LNG Portovaya to Chinese Guangxi Beihai regasification terminal in port of Taishan. Thus, this plant repeated success of Arctic LNG 2. Negotiations are underway to build regasification terminals in Sri Lanka, India, Bangladesh, and Philippines. Meanwhile, shortage of Arc7 ice-class LNG carriers has reduced the possibility of LNG export from Arctic LNG-2.
On 03.12.2025, European Council and European Parliament decided to abandon import of Russian gas into EU. Pipeline gas supplies must stop no later than 30.09.2027, and in some cases before 01.11.2027. A transition period is provided for existing contracts. For short-term contracts signed before 17.06.2025, the ban will take effect from 25.04.2026 for LNG and from 17.06.2026 for pipeline gas.
As of 26.12.2025, there were 48 LNG plants in the world with total LNG liquefaction capacity of 517 MTPA. 9 plants were fully or partially idle with total non-operational capacity of 34 MTPA.
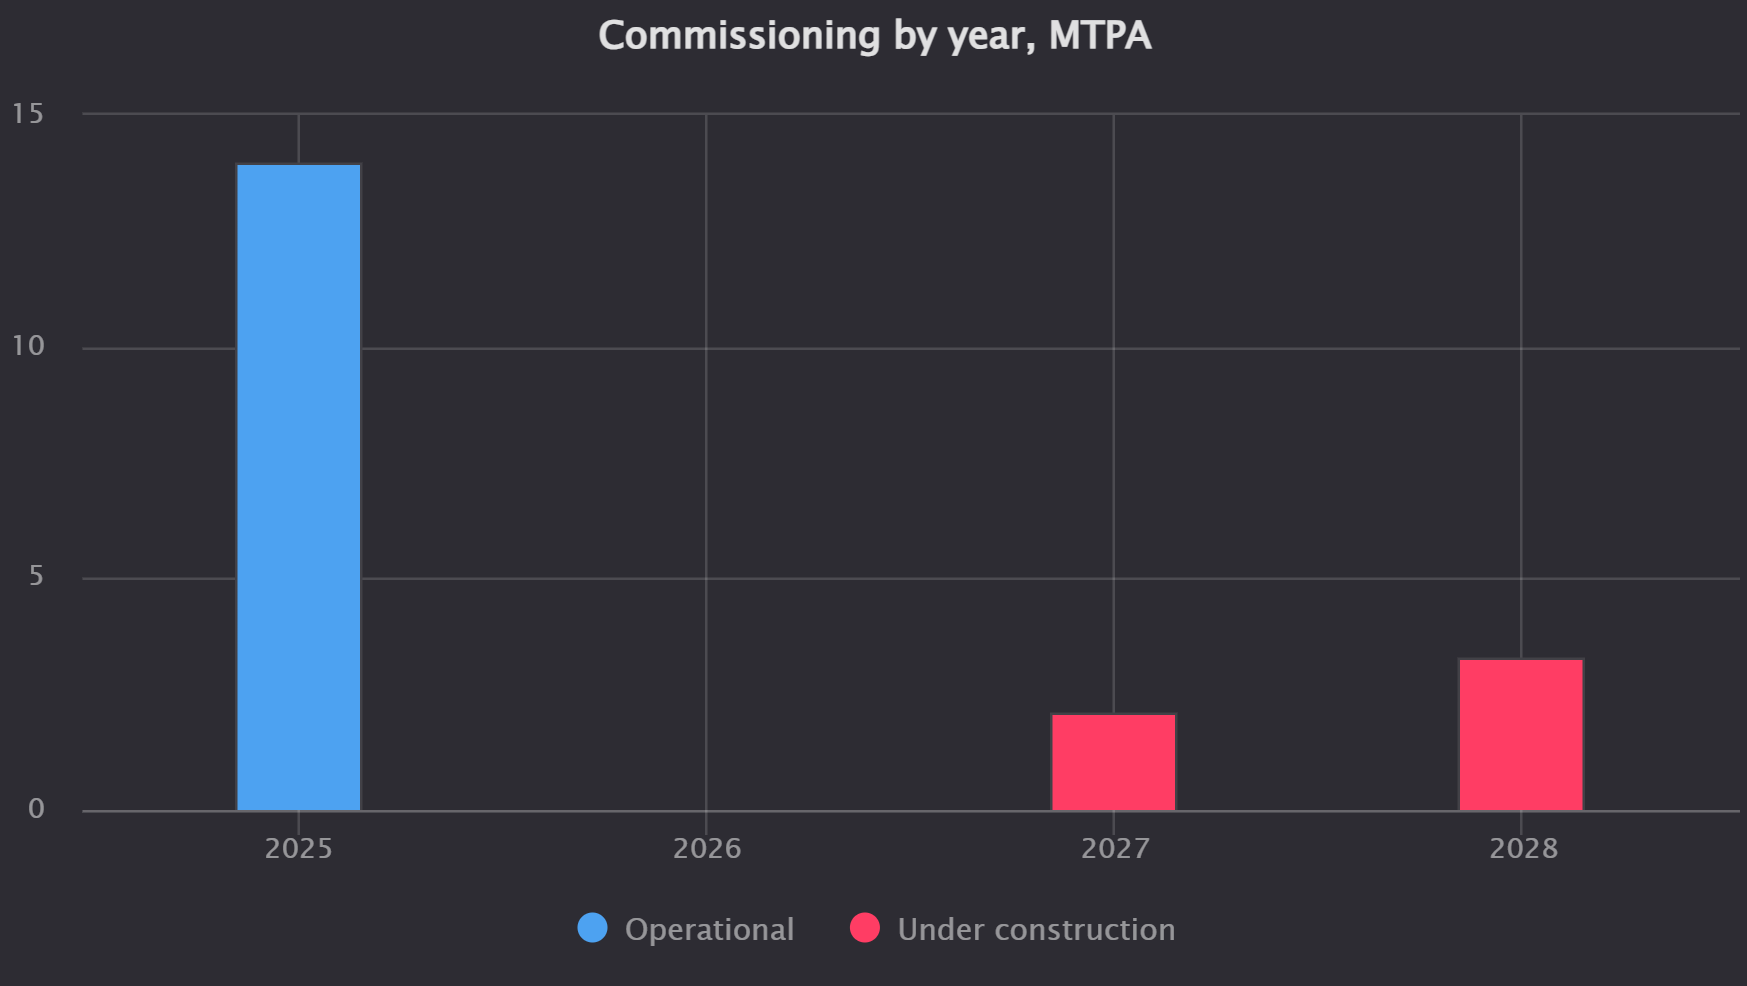
2025 is record year for commissioning of LNG capacities - 50 MTPA, including new LNG plants and new trains of existing LNG plants. Most of it is commissioning of Plaquemines LNG plant, as well as Canada's first LNG plant. Next year, even more capacities will be commissioned – 64 MTPA. LNG market will grow by 24% within two years. It significantly exceeds 1.2-1.7% average annual growth of global natural gas consumption. USA dominates in new build – 52% in 2025, 41% in 2026.
USA remained to be number one LNG supplier in Q4. Qatar and Australia are in the top three. Russia is the fourth.
As of 06.01.2026, there were 206 regasification terminals in the world with a total regasification capacity of 1099 MTPA.
Regasification capacities of 98 MTPA are expected to be commissioned this year. Y-o-Y growth is 9%. China’s share in capacity build up is 36%. Egypt and India are in top 3.
China was leader in LNG discharge in Q4. Japan and South Korea are in second and third places respectively.
Indonesia is following Egypt’s way and moving away from exporters status. Domestic LNG consumption is already more than a third of LNG production. It leads to delaying of obligatory export cargoes.
As of 08.01.2026, stocks of active natural gas in UGS of EU and UK amounted to 63.5 bcm. Stocks are significantly lower than in previous years – minus 13.1 bcm compared to previous year and minus 29.6 bcm compared to 2024.
As of 05.01.2026, there were 943 operational LNG carriers, including bunkering vessels, FSRU, floating LNG plants and floating storages with 64.1 MT of total cargo hold capacity. In 2025, LNG carriers with record-breakin 6.1 MT of total cargo hold capacity were commissioned.
LNG spot price in East Asia (JKM) as of 12.01.2026 was 9.73 USD/MMBtu. LNG excess led to price stagnation even despite high season (-10% compared to end of Q3).Futures curve implies a further decline in spot prices in the coming years. Spot LNG shipments from the United States to the EU and the United Kingdom with a price formula linked to the Henry Hub have near-zero margins for independent traders. Its spot shipments to East Asia have extremely thin margins and continue to decline. Spot supplies by vertically integrated LNG producers and buyers continue to be in the green zone.
LNG plants
As of 26.12.2025, there were 48 LNG plants in the world, including partially idle ones, with a total operational LNG liquefaction capacity of 517 MTPA.
9 plants were completely or partially idle with a total non-functioning capacity of 34 MTPA. List of idle plants and trains:
Marsa el Brega LNG in Libya.
Yemen LNG.
Train 1 at the Atlantic LNG plant in Trinidad and Tobago.
Cryogaz-Vysotsk plant in Russia
Trains C, D, E of the Botang LNG plant in Indonesia.
Darwin LNG Plant and train 2 of the Northwest Shelf LNG plant in Australia.
Damietta LNG plant and Egyptian LNG plants in Egypt. EGAS at Idku discharges rare LNG cargoes from time to time.
As of 12.01.2026 trains at 23 plants (including expansion projects for existing plants and debotlenecjing projects) are under construction with new liquefaction capacity of 179 MTPA (35% of current operational capacity). Such an extremely high development rate for any industry indicates the upcoming changes in the industry in the coming years, which will be negative for LNG producers.
In 2025, 50 MTPA of LNG capacity was commissioned. Even larger volume of liquefaction capacity is expected to be commissioned next year - 64 MTPA. USA dominates this process - it accounted for 52% of new capacity in 2025 and will account for 41% in 2026.
Loading
According to Seala AI, the United States remained the number one supplier of LNG to the global market in the third quarter. Qatar and Australia are in the top three. Russia is the fourth.
USA
USA exported 115.1 million tons of LNG in 2025. USA is number one LNG producer. US LNG industry is living its best life thanks to technological advances and CIA fieldwork.
Q4 LNG shipments from the United States amounted to record-breaking 32.0 million tons. Utilization of existing by the end of the quarter capacities exceeds 100%.
Export portfolio of US LNG was very diversified in Q4 2025. EU and UK is main focus of supply for US LNG.
USA continues to successfully monetize the crisis in Eastern Europe started in 2013 under Biden administration (vice president in 2009-2017, president in 2021-2025) and consequent elimination of Russian energy resources from the European market. Commissioning of US LNG plants is synchronized with the disconnections of Europe from Russian gas and LNG.
In September, final investment decision was made on construction of Train 4 of Rio Grande LNG plant. Capacity of the train is 5.4 MTPA. Commissioning is scheduled for December 2030.
In the coming years, the balancing of the Atlantic Basin market will be managed by the United States by limitation of export of Russian pipeline gas and LNG.
Details of LNG shipment from the USA are available at the link.
Canada
Q4 loadings amounted to 1.3 million tons. Cargoes were delivered to Japan, South Korea and China (including Taiwan province).
Two more local LNG plants are underway:
Woodfibre LNG plant near Vancouver with capacity of 2.1 MTPA.
Cedar FLNG plant next to Canada LNG with capacity of 3.3 MTPA.
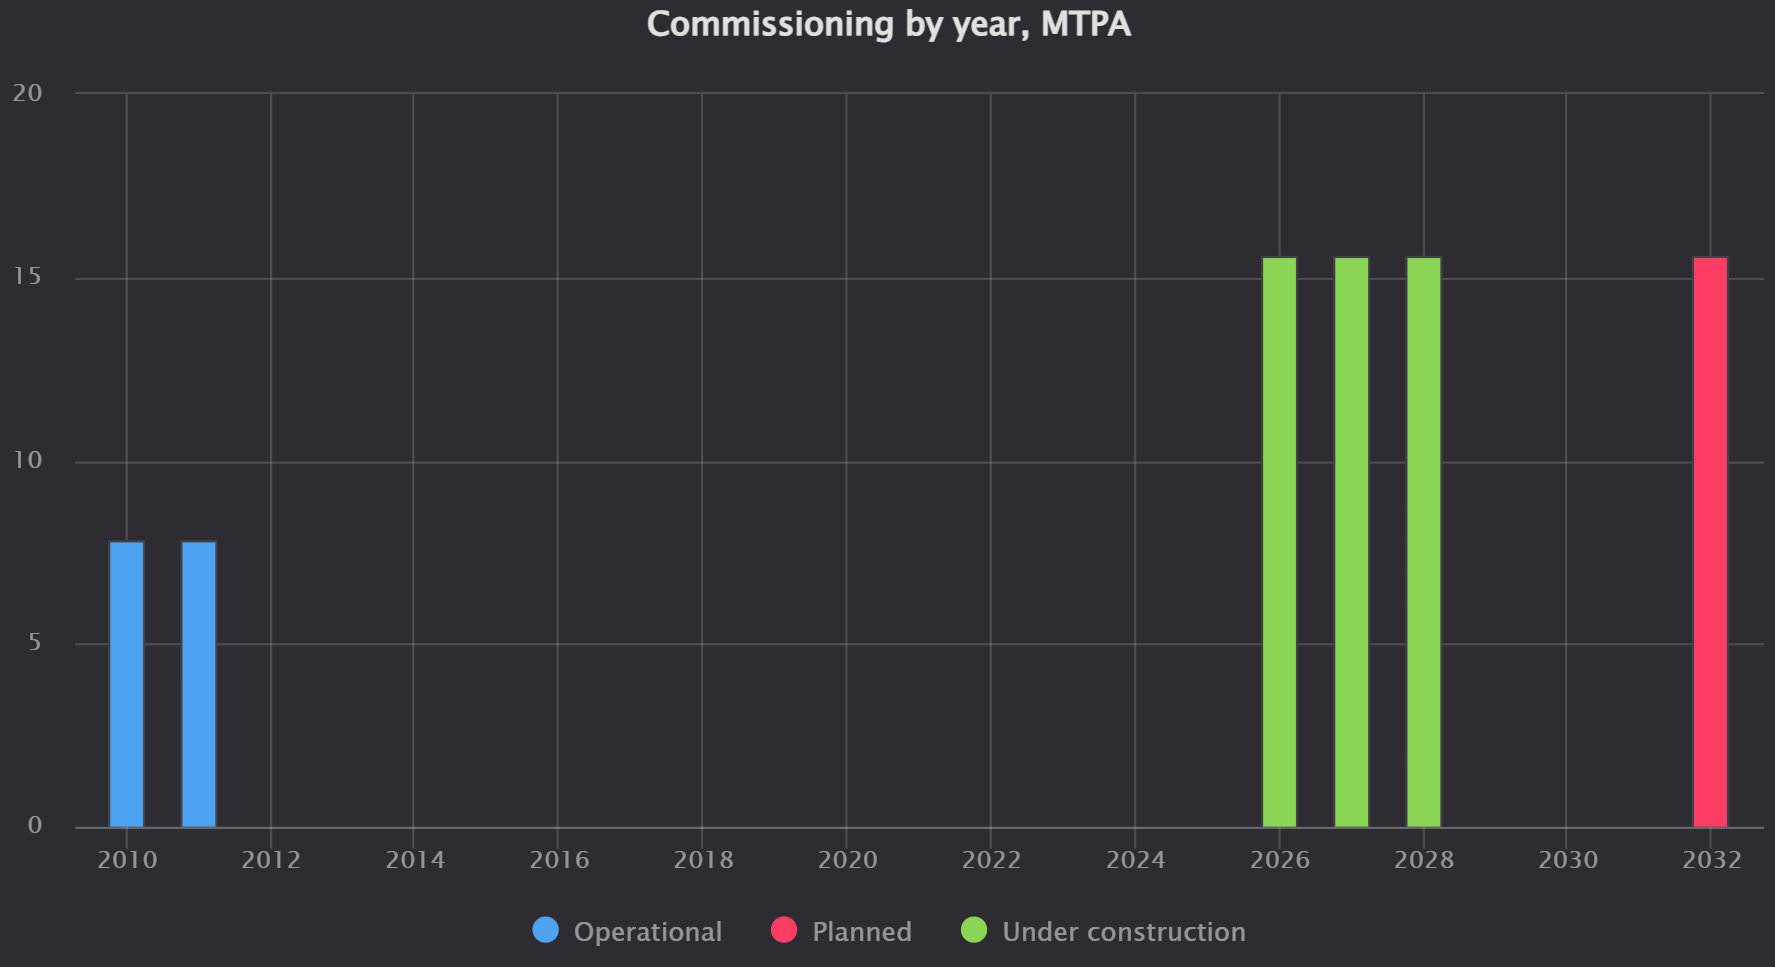
Canada LNG capacity build-up
Mexico
Q4 export volumes were in line with previous quarters - 341 kt.
Construction of LNG facilities is under way in Mexico - as of 12.01.2026 - 4.7 MTPA capacity is under construction, and 27.2 MTPA is planned. Construction projects (Energia Costa Azul LNG, New Fortress Altamira FLNG) are delayed again.
Trinidad and Tobago
Q4 2025 LNG loadings totaled 2.5 million tons. Utilization of operational capacities of the only LNG plant Atlantic LNG (11.8 MTPA without idle Line 1) amounted to 85%.
Traditionally, LNG from Trinidad and Tobago is shipped worldwide and has a diversified customer base.
Peru
Q4 2025 LNG loadings totaled 1.0 million tons. Utilization of the only LNG plant (4.4 MTPA) was 91%.
Qatar
Q4 2025 LNG loadings at QatarEnergy LNG’s combined QatarGas and RasGas plant amounted to 20.4 million tons. Plant utilization - 105%.
Qatar became number one supplier to China.
Qatar's main efforts are focused on construction and contracting of future supplies for expansion of QatarGas plant with total capacity of 47 MTPA. Launch of 6 trains will be carried out sequentially in 2026-2028.
LNG capacity build-up in Qatar
Earlier, European Commission announced an additional tax (formally in the form of a fine) on LNG imports from Qatar in the amount of 5% of the global revenue of Qatar Energy. Estimated amount of the payment requested by the EU for right to continue supplying Qatari gas to the block is 8 bAED / 16 bCNY / 181 bINR / 210 bRUR / 2 bUSD. In October 2025, Qatar's Minister of State for Energy and CEO of Qatar Energy, Saad bin Sharida al-Kaabi, explicitly indicated that Qatar was considering refusing to supply LNG to the EU if an attempt was made to confiscate the amount of the so-called fine.
In July, QatarEnergy began deliveries to Isle of Grain regasification terminal near London area under 25-year lease agreement for 7.2 MTPA of regasification capacity (half of the terminal's total capacity). This indicates Qatar's desire to maintain supplies to the European market and reduce dependence on the decisions of European Commission.
Details of Qatar's exports are available at the link.
UAE
Q4 2025 loadings at the only LNG plant Das Island (7.6 MTPA) amounted 1.1 million tons. Utilization was 57%.
The second LNG plant in the country, Ruwais, is expected to be launched in 2029. The plant's capacity will be 9.6 MTPA.
Discharge at regasification terminal in Jebel Ali (Emirate of Dubai) amounted to 210kt in Q4. Traditionally, discharges at this terminal peak in third quarter of each year during heat wave.
Emirate of Abu Dhabi keeps has accelerated M&A in the global gas market since early 2025. Main agents of abroad presence are ADNOC and the Mubadala Investment Fund.
In November ADNOC through XRG signed a non-binding agreement to acquire a stake in Azerbaijan's Southern Gas Corridor. This investments support XRG's regional strategy in the Caspian Sea and will facilitate gas supplies from Azerbaijan to the European market. The Southern Gas Corridor was founded in February 2014, and the Ministry of Economy of Azerbaijan and SOCAR participate in it.
Final investment decision on Commonwealth LNG plant in the United States, in which ADNOC has an effective share of 24.1%, is expected to be made in the fourth quarter. This will increase the company's perspective LNG portfolio.
Details of Emirati gas market are available here.
Oman
Loadings at the only LNG plant (11.4 MTPA) amounted to 3.0 million tons in Q4 2025. Utilization of the design capacity was 105%.
Key importers of Q4 resource were Japan, India, China and South Korea.
Australia
LNG plants update
Northern Australian LNG projects are facing a steady decline in gas production.
Darwin LNG plant (3.7 MTPA) has been idle since November 2023. Launch of Barosso gas field, whicj gas reserves 2P (total proven and probable reserves) are estimated at 110 bcm, will allow restart of Darwin LNG plant. Barosso commissioning is delayed till 2026-2027.
Train 2 of Woodside Energy’s Northwest Shelf LNG plant (2.5 MTPA) continued to be idle due to economic reasons. The launch of the second stage of development of the Waitsia gas field in the third quarter of 2025 will provide additional gas resources for the Northwest Shelf LNG plant.
The Scarborough natural gas field, located in the Carnarvon Basin, about 375 km off the coast of Western Australia, is expected to be commissioned in 2026. The development includes the installation of a semi-submersible floating production facility moored at a depth of 950 m, connected by a pipeline with a length of about 430 km to the second line of the Pluto LNG plant with a capacity of 5 million tons/year at an existing onshore facility.
In December 2025, the Australian government made a proposal to reserve from 15 to 25% of the gas produced in the fields for the domestic market starting in 2027. Presumably, this will affect the possibility of concluding new LNG supply contracts in 2027 and later.
LNG loadings
LNG loadings at Australian plants totaled 19.3 million tons in Q4 2025. Utilization of operational capacities (excluding long-term idle) - 95%.
In Q4 2025 Australia traditionally became the number one LNG supplier to Japan and South Korea, but lost number on position to Qatar in China.
Gas production developments
In December 2025 stage 2 of development of Waitsia gas field was launched. It will provide additional gas resources for Northwest Shelf LNG plant.
Launch of the Barosso gas field, which gas reserves are estimated at 110 bcm of gas at 2P (total proven and probable reserves), will allow restart of Darwin LNG plant. As of now FPSO was build and its topside equipment is being mounted. Undersea pipeline between Barossa FPSO and Darwin LNG plant is being laid. Restart of the LNG plant is expected late 2026 / early 2027.
Potential Australia - China trade war
Export of LNG from Australia to China were currently interrupted in 2021-2022 due to the first Australia-China trade war.
At the same time, Australia is one of the key participants in the US anti-Chinese military alliances in Asia, including:
AUKUS (USA, UK, Australia),
Quad (USA, Australia, India, Japan),
Five Eyes (USA, UK, Canada, Australia, New Zealand).
ANZUS (USA, Australia, New Zealand),
Australia - Papua New Guinea bilateral treaty.
The numerous military alliances against China and the intensification of Australia's cooperation with other countries within the framework of these alliances in 2025 make the risk of a repeat of the Australia-China trade war and the suspension of all Australian LNG exports to China extremely high.
Details of Australia's exports are available at the link.
Papua New Guinea
Q4 2025 loadings at the country's only LNG plant (8.3 MTPA) quarter amounted to 1.8 million tons. Utilization of the design capacity was 87%.
All cargoes go to neighboring East Asian countries - China (including Taiwan), Japan and South Korea.
Brunei
Q3 2025 loadings at the only LNG plant (7.2 MTPA) amounted to 1.0 million ton. Utilization of the design capacity was 57%.
All cargoes go to neighboring East Asian countries - China (including Taiwan), Japan and South Korea.
Indonesia
LNG loadings amounted to 4.7 million tons in Q4 2025, including 328 kt transhipment at regasification terminals Lhoksemuawe and Blang Langang.
LNG discharge at own regasification terminals amounted to 1.8 million tons (41% of the country's production). This is record result. Overall demand for natural gas and demand for LNG are steadily growing in this 285 million country. LNG demand growth is driven by both overall population and basic economy growth, and transition of a number of energy facilities to gas (for example, small scale power plants which were previously running using diesel fuel, general gas supply to remote, isolated areas).
Stagnant LNG production (18.0 MPTA in 2024), growing demand (6.1 MTPA in 2024) and a high level of export commitments (10.2 MTPA of mandatory export supplies as of 15.10.2025) lead to commercial shortage of LNG - there is no longer enough domestic production for own consumption and for the fulfillment of export contracts. It is estimated that up to 50 shipments for export were cancelled in 2025. The deficit will only grow every year.
Malaysia
LNG loadings at Malaysian plants totaled 7.6 million tons in Q4 2025. Utilization of the design capacity (32 MTPA) was 95%.
Discharge at Malaysian regas terminals amounted to 625kt (8% of domestic LNG production). Domestic demand for LNG is stable.
In October 2025, it became known that the government plans to make natural gas the main fuel of the local electric power industry by 2032 and replace coal in this capacity. Thus, the government will invest in a wide range of gas assets.
Details of Malaysia's exports are available at the link.
Russia
LNG plants loadings
LNG shipments from the plants totaled 9.6 million tons in Q4. On top of it 805 kt were loaded on transhipment hubs.
5.5 million tons were shipped from Yamal LNG (Sabetta port). France, Belgium, China and Spain became key buyers of Q4 cargoes.
3.0 million tons was loaded at Sakhalin-2 (Prigorodnoye port). Most of Q4 cargoes went to Japan. Japan continues to receive so-called “permits” from the United States to import LNG from Sakhalin-2. There were also shipments to China and South Korea.
Official sales of LNG from Arctic LNG 2 in 2025 amounted to 1 million tons. Seala AI data shows loadings in the amount of 1234 kt in 2025, including 669 kt in Q4. Shortage of Arc7 ice-class LNG carriers has reduced the ability to export LNG from Arctic LNG 2 in cold times. During winter navigation (December - mid-June), LNG carriers with Arc7 ice-class are required to export LNG from Arctic LNG 2. In December 2025 - January 2026, only one such LNG carrier, Christophe de Margerie (9737187), operated in shuttle mode between Utrenny terminal (Arctic LNG-2) and Saam FSU (9915090) in Murmansk oblast. In January 2026, a new Russian Arc7 ice-class LNG carrier Alexey Kosygin (9904546) will jointhis route. It will double the ability to export and, consequently, produce LNG to Arctic LNG 2. Another challenge is the lack of regas terminals (except for Beihai) to reach the design capacity of both plant 6 MTPA trains.
In December, the first LNG cargo was delivered by LNG carrier Valera from Gazprom LNG Portovaya medium-tonnage LNG plant to Chinese Guangxi Beihai regasification terminal in the port of Taishan. Thus, this plant repeated the success of Arctic LNG 2. Q4 loadings amounted to 285 kt. The plant’s utilization - 76%.
Comparing Chinese customs data on Russian LNG imports to China with our tracker, we can hypothesize that there may be more Russian LNG flowing into China than our and foreign flow trackers indicate, with an additional volumes in the amount up to 500 kt per month.
A possible logistical scheme is transshipment of LNG in the territorial waters of Malaysia to the east of Singapore, by analogy with transshipment of oil in the same region. For example, Russian LNG from Gazprom LNG Portovaya medium-tonnage plant was transshipped on October 24 from LNG carrier Pskov (9630028) to LNG carrier CCH Gas (9307205). This gas carrier probably delivered LNG to China, but this delivery could not be tracked.
The last cargo from Cryogaz-Vysotsk left on February 17 and was delivered to Zeebrugge, Belgium. There were no shipments in Q4.
Sovereign exports of Russian LNG is slowly expanding. Negotiations are underway to build regasification terminals in Sri Lanka, India, Bangladesh, and the Philippines.
Piped gas export
Pipeline gas export in 2025 decreased to 115 bcm (315 mcm per day) compared to 119 bcm in 2024. 2025 is the first year without direct supplies of Russian gas to EU. Plan for 2026 is 118 bcm. Russian export have bottomed out this year, and now it face the challenge of slowly but surely building off.
Gas supplies to China via the Power of Siberia-1 in 2025 amounted to 38.8 bcm (106 mcm per day), which is 800 mcm more than the contract volume. Sypplies increased by 25% compared to 2024.
Deliveries of Russian gas to EU through Türkiye in 2025 amounted to 18.1 bcm (50 mcm per day).
Gas supplies to Belarus in 2025 remained at the same level - 17 bcm (47 mcm per day).
In 2025 Gazprom continued supply of pipeline gas to Uzbekistan transited through Kazakhstan in full accordance with 7.7 bcma (21 mcm per day) contract. Plan for 2026 is to increase volume of supplies to 11 bcma (30 mcmc per day).
Russian gas exports continue to turn towards Asia, including for forced reasons with US origin. However, redirecting flows will require significant time and investments.
In Q4 organization of technical design of Power of Siberia - 2 gas pipeline began. At the same time, a firm contract has not yet been signed. Design, construction and commissioning works will take 8 to 10 years.
In October 2025, Gazprom and Kazakhstan signed a memorandum on the construction of a new gas pipeline from Russia to Kazakhstan with initial capacity 10 bcma.
Gazprom continues to experience financial difficulties, but the situation has stabilized. Since the beginning of 2025, the additional mineral extraction tax in the amount of 600 billion rubles per year has been abolished ahead of schedule.
Transit to Kaliningrad region via Lithuania
10 years agreement on transit of Russian gas through Lithuania to Kaliningrad Region expired in 2025. The contract volume for transit was 2.5 bcma. The contract included “transport or pay" clause. Actual transit volume in 2025 was at the contract level. Price of the transit under expired contract was 13 million euros / 1.2 billion rubles. Unit cost of transit was 0.02 AED / 0.04 CNY / 0.46 INR / 0.48 RUR / 0.61 US cents per cubic meter of natural gas.
At the end of 2025 the contract was renewed for 5 years. Transit price increased 2.2 times to 29 million euros / 2.7 billion rubles. Unit cost of transit will increase to 0.05 AED / 0.10 CNY / 1.02 INR / 1.07 RUR / 1.35 US.
Details of Russian gas market are available at the link.
Norway
Q4 2025 loadings at the country's only large-tonnage plant Hammerfest Snøhvit (4.2 MTPA) amounted to 996 kt. The achieved utilization was 92%. All of the LNG cargoes was supplied to EU and UK.
Small-scale Risivika (330 kt per yer) operated at its design capacity and provided LNG bunkering and small parcels for local consumers.
Mozambique
Q4 2025 loadings at the only LNG plant Coral South (3.4 MTPA) amounted to 931 kt. This indicates 110% utilization.
In December 2024, the final investment decision was made on Coral North floating LNG plant project. The country's second floating LNG plant with a planned capacity of 3.4 MTPA is expected to be commissioned at the end of 2027. Owners of both Coral projects are the Italian Eni, ExxonMobil from the USA, Chinese CNPC, South Korea’s the Korean Gas Corporation, UAE’s ADNOC and the local Empresa Nacional Hydrocarbons. Mozambique's share in these projects is tiny 10%. On top of this, LNG sales of ENH’s 10% share are controlled exclusively by Dutch Vitol.
In October 2025, Total Energy lifted the force majeure on Mozambique LNG Zone 1 onshore project with 13 MTPA capacity and is preparing to resume construction work. Construction was stopped in 2021 due to a confrontation with the local population, which led to numerous deaths. This project is 100% controlled by foreign companies from France, Japan, India and Thailand, which is probably the real reason for the discontent of local communities. Key area of preparation is project financing. TotalEnergies is demanding compensation from the Government of Mozambique in the amount of 4.5 billion USD for the delay in the implementation of the project.
In addition, ExxonMobil’s Rovuma LNG (18 MTPA) project is under development. Final investment decision is expected in 2026. However, there is limited economic sense nowadays for US company to develop LNG project abroad and compete with domestic US LNG projects. The only exception if ExxonMobil will grab almost all profit of this project. ExxonMobil canceled in the end of October a public meeting jointly with Mozambique's president, Daniel Chapo, at which they were supposed to reaffirm the company's commitment to the Rovuma LNG project. Security situation may well be the reason for that cancellation.
Thus potential Mozambique’s liquefaction capacity is up to 38 MTPA.
Details of Mozambique's LNG industry are available at the link.
Angola
LNG exports from Angola are growing in 2025 due to increased gas production at Sankha field. Q4 2025 loadings amounted to 1.1 million tons. Utilization of the only LNG plant (5.2 MTPA) amounted to 87%.
The increase in gas production at this depleted oil field has provided 2.3 mcm per day (0.8 bcm per year) of additional resource for Angola LNG. At the second stage of production improvement at this field, additional supplies to the LNG plant are expected in the amount of 6 mcm per day (2.2 bcm per year). Operational capacity of the Angola LNG plant is 5.2 MTMA, which is equivalent to 7.1 bcm per year of natural gas.
Previously, Angola LNG's main resource was associated gas from offshore oil platforms. Natural decline in oil production led to a decrease in the associated gas resource for the LNG plant. New gas consortium plans to add up to 12 mcm of gas for the LNG plant from the pure Quiluma and Maboqueiro gas fields, which will ensure full utilization of the plant and give feasibility for its expansion.
Republic of the Congo
The second floating LNG plant Nguya has officially started operations on December 2. Capacity of the FLNG is 2.4 MTPA. The plant's resource base is the Nene Marine offshore oil and gas field, which is already operating.
The project is being developed by Italian ENI (65%), Russian Lukoil (25%) and domestic SNPC (10%) with production sharing approach. US attack on Russian oil ang gas company Lukoil creates issues for Lukoil to participate further in this project.
Q4 loadings amounted to 202 kt.
Equatorial Guinea
Punta Europe floating LNG plant (3.7 MTPA) continues stable shipments. 537kt were loaded in Q4 2025. Achieved utilization is 58%.
Cameroon
Cameroon floating LNG plant (2.4 MTPA) continues stable shipments. Q4 2025 loadings amounted 424kt, which indicates 71% utilization of the plant.
Hilli Episeyo (7382720), which is the basis of this LNG plant, will finish its work in Cameroon in December 2026 and will be moved to Argentina for a new GLNG project. In Q2 2025, the vessel was chartered for 20 years for this new project.
Nigeria
Loadings at Nigeria LNG, the only LNG plant, amounted to 4.5 million tons in Q4 2025. Utilization of the design capacity (22.2 MTPA) is 81%.
Mauritania and Senegal
Q4 2025 loadings amounted to 530 kt (at par Q3).
Commissioning of trains 3 and 4 are delayed again. Current estimates are Q1 2026 for start of train 3 and Q2 2026 for train 4.
Algeria
Loadings at the country's two LNG plants amounted to 2.3 million tons in Q4 2025. Utilization of design capacity (25.5 MTPA) - 36%.
Decline in gas production and prioritization of domestic market and pipeline exports have led to low and continuing to stagnate LNG plant loadings.
Details of Algerian exports are available at the link.
Detailed export statistics by country are available at the link.
Regasification terminals
As of 06.01.2026, there were 206 regasification terminals in the world with a total regasification capacity of 1099 MTPA.
Regasification capacities of 98 MTPA are expected to be commissioned this year. Y-o-Y growth is 9%. China’s share in capacity build up is 36%. Some of the projects were delayed till 2026.
Egypt and India are in top 3.
In 2026, it is expected that 90 MTPA of regasification capacity will be commissioned. China will continue to be the leader, with 38 MTPA of new build-up.
Discharge
According to Seala AI, China once again became the leader in LNG discharge. However, quarterly discharge volumes keeps falling. Japan and South Korea are in second and third places respectively. India is feeling more and more confident itself in fourth place.
China
Mainland China
China continues to dominate in regas capacity newbuild. China continues to rely on its gas infrastructure and actively develop it. China is flexible in LNG purchases - balancing is carried out by pipeline gas, coal, and hydroelectric power plants.
As of 06.01.2026, there are 38 operating regasification terminals in China with total capacity 165 MTPA (excluding Taiwan province).
On 15.11.2025 LNG carrier Maran Gas Coronis arrived at the Yangjiang LNG terminal in Guangdong, indicating that its has started commissioning. Phase 1 of the terminal has initial regasification capacity of 2.8 MTPA and 320 thousands cubic metres of LNG storage capacity. Phase 2 – 3.2 MTPA of regasification capacity and 480 thousands cubic metres of LNG storage capacity. Yangjiang will mainly serve Guangdong province, but it can also serve Guangdong–Hong Kong–Macao Greater Bay Area during winter time.
2026 is expected to be a record year for the commissioning of regasification terminals in China - 38 MTPA. However, there is already some regional surplus of regas capacity. It led and keeps leading to low utilization levels for new and existing terminals.
LNG deliveries to China totaled 18.8 million tons in Q4. Utilization of regasification terminals was 46%.
Key suppliers in 2025:
Qatar - 20.4 million tons
Australia - 20.1
Russia - 7.6
Malaysia - 7.2
Indonesia- 4.1
Export structure of the 5 largest LNG producers to China has changed in 2025. Australia has ceased to be the largest exporter to China this year, losing the first place to Qatar. China is slowly abandoning Australian resources in response to Australia's involvement in anti-Chinese military alliances. There are 5 of them, and there has been an increase in activity for almost every one this year. LNG exports from the United States to China have fallen victim to Trump's tariffs, ranking 9th this year and near zero volumes since April. For the first time, Russia entered the top three at the end of the year and overtook Malaysia. This creates optimism for the Russian LNG industry. The alliance of the manufacturer and the buyer dramatically reduces the possibility of effective counteraction from third countries.
It is worth noting that natural gas supplies from Russia to China via the Power of Siberia are growing every quarter. It is expected that designed capacity (38 bcm per year) will be reached in Q4 2025. In 2024, 31 bcm were delivered. In 2025, 35 bcm is expected to be delivered Thus, in 2025, the Chinese market have recieved an additional 5-6 bcm of natural gas, which is equivalent to 332 kt LNG per month.
Volume of physical re-export of LNG from China amounted to 260 kt.
Taiwan province
Q4 2025 LNG imports amounted 5.9 million tons. Utilization of the regas terminals (20.0 MTPA) was 119%. LNG import volumes have been relatively stable for a long time.
Taiwanese CPC has 8 long-term SPAs with 10.9 MTPA firm import volumes (2.7 million tons per quarter).
Details of Chinese gas market are available here.
Japan
Q4 2025 discharges amounted 16.6 million tons. Utilization of regas capacity (216 MTPA) was 31%. Japanese regas capacity is in excess. Excess capacity created for insuring that peak seasonal and regional demands will be met, as well as overcoming possible problems with nuclear and coal generation.
Key suppliers in 2025:
Australia - 23.3 million tons
Malaysia - 9.7
Russia - 6.0
Japan has a very diversified supplier base - cargoes from 16 countries were delivered to Japan in 2025. Many of these supply lines are controlled by Japanese oil and gas companies, including ownership of LNG carriers, shares of LNG plants and underlying gas fields.
Due to the lack of significant economic growth and slow extinction of the Japanese population, domestic gas consumption stagnates. Recommissioning of nuclear power plants that were shut down after Fukushima in 2010 has an additional impact to decrease in LNG import. However, there are delays of restart dates of power units due to regulatory issues.
Japanese gas companies are developing the trading of long-term contracted LNG volumes to third countries. This includes investing in regasification capacities in Southeast Asian countries, as well as pressure on non-Japanese owned LNG suppliers to cancel destination clause in long-term contracts. Due to huge Japanese LNG fleet and the emerging optionality in gas supply directions, it is reasonable to expect further increase in the international trading activity of leading Japanese gas companies.
South Korea
Q4 2025 LNG import totaled 11.8 million tons. Utilization of the design capacity of regas terminals (146 MTPA) is 32%.
Key suppliers in 2025:
Australia - 15.6 million tons
Qatar - 7.4
Malaysia - 7.0
USA - 4.3
Russia - 2.5
The structure of LNG suppliers to South Korea is very diversified and consisted of 19 countries in 2025.
Singapore
LNG deliveries to Singapore in Q4 amounted to 2.5 million tons, of which 1025 kt were re-exported and approximately 173kt were sold as a bunker.
Utilization of the regasification terminal (11 MTPA) without re-export and bunkering was 47%.
Details of the import and re-export of LNG by Singapore are available at the link.
Thailand
Gas-fired TPPs account for more than half of power generation in Thailand. Therefore, LNG demand strongly depends on seasonality of electricity demand and availability of cheaper sources of electricity (primarily hydroelectric power plants).
The period from March to May is the peak period in terms of electricity demand.
Q3 2025 LNG imports amounted to 2.3 million tons. It is the lowest volume since Q4 2022. Utilization of the terminals (19 MTPA) was 48%.
Bangladesh
Q4 2025 LNG imports amounted to 1.6 million tons. Utilization of two FSRUs (7.5 MTPA) was 86%.
Bangladesh is a promising market for new LNG exporters - fast growing population and energy demand of this 176 million country can consume many times more LNG in the near future.
India
Q4 2025 LNG imports totaled 6.4 million tons. Utilization of terminals (51.5 MTPA) was 49%.
Key suppliers in 2025:
Qatar - 11.5 million tons
USA- 3.0
UAE- 2.9
Oman- 2.2
Nigeria- 1.7
It is worth noting the statement made by the Indian Minister of Energy while visiting USA that India will not import LNG from the Arctic LNG-2 project due to threats from the United States. Success story of Russian offshore oil exports, where India has become the dominant buyer of redirected supplies, has not been repeated with Russian LNG yet.
In early October, it became known that Gazprom was negotiating the construction of a regasification terminal in India. The construction of the terminal is being considered at Kakinada port on the east coast of India. The terminal's capacity is 5 million tons of LNG per year. The volume of investments is 2.3 bAED / 4.4 bCNY / 57.4 bINR / 50 bRUB / 0.64 bUSD. This terminal can become both the anchor recipient of LNG from the new LNG plant in Ust-Luga, and the recipient of LNG from Sakhalin-2 in case Japan abandons it.
On 07.11.2025 Indian government put forward in court its case against consortium of domestic Reliance Industries and British BP for 110 bAED / 210 bCNY / 2.7 tINR / 2.4 tRUB / 30 bUSD in gas underproduction at the deepwater D1 and D3 fields in the KG-D6 block (Krishna-Godavari basin) in Bay of Bengal. This is the largest government lawsuit against a corporation in Indian history. The government insists that the companies decreased recoverable reserves at 292 bcm to 88 bcm and only 20% of the original volume has been actually produced. Authorities accuse the private Indian company Reliance of mismanagement: using only 18 wells instead of the planned 31, as well as using "overly aggressive" production methods, which led to reservoir damage and the loss of reserves. The project was developed since 2000 under a production-sharing contract. Under the terms of the contract, the companies initially reimbursed costs from revenues and then shared profits with Indian government (starting at 10% and up). Arbitration award is expected by mid-2026,.
Pakistan
Main consumers of LNG in the country is gas-fired thermal power plants. Gas-fired thermal power plants compete in generation stack with sun power plants, which are being actively developed. As of 03.07.2025, Pakistan has 14.7 GW gas-fired TPP. This is equivalent to 23 MTPA in case of base loading, excluding repairs. 2024 LNG import volume amounted 8.2 million tons.
Pakistan has a population of 242 million people. Economic growth rate is 3.2% (of which 1.6% is due to population growth). The territory of Pakistan is poor in terms of hydrocarbons reserves. Pakistan has huge potential for LNG and pipeline gas imports in the future. Per capita energy consumption remains at a very low level and has a high potential for growth. But the poverty of the population and high risks for infrastructure projects hinder the growth of LNG imports.
Pakistan subsidizes domestic gas and electricity prices. Under IMF pressure Government of Pakistan raised in 2025 gas and electricity prices in order to reduce budget expenditures. This is expected to reduce the demand for electricity. In addition, this will reduce the demand for LNG imports in H2 2025 and beyond, with an additional impact from the growth of installed SPP capacity and economic prioritization of coal-fired generation over gas-fired.
Q3 2025 discharges amounted 1.9 million tons. Utilization of two operating terminals (10.5 MTPA) was 72%.
All cargoes in Q3 came from Qatar. Pakistan has two long-term contracts with Qatar for the supply of 5.7 MTPA (1.4 million ton per quarter).
There is also a long-term contract with Eni for the supply of 700 kt per year (175 kt per quarter).
There are reports of delays in payments by Pakistani companies for already delivered LNG cargoes. However, it is unlikely that this will be a constraint for Qatar Energy due to Qatar's interest in strong bilateral relations with Pakistan.
In September 2025, Pakistani LNG importers Pakistan State Oil Company (PSO) and Sui Northern Gas Pipelines Limited (SNGPL) requested QatarEnergy’s consent to reduce the number of cargoes under existing SPA. These companies presented the Qatari exporter four options for rationalizing LNG supplies due to limited flexibility under existing contracts. This step was taken due to t oversupply of regasified liquefied natural gas at domestic marker caused by a decrease in demand from private and energy consumers. A decrease in demand, especially from gas TPPs, after an increase in fixed tariffs and the introduction of autonomous fees, led to a surplus of natural gas on the market. It is predicted that between July 2025 and 2031, about 177 LNG cargoes will remain surplus.
In October 2025, it was reported that Pakistan plans to cancel 24 shipments of LNG from Qatar in 2026.
Iran
In June 2025, Iran successfully launched the fourth gas purification complex at the 14th phase of the South Pars gas field. Iran's gas production continues to grow rapidly. On top of this Iranians build new facilities using their own technological and financial resources.
In Q4, pipeline gas supplies from Iran to Iraq (Bahdad, Basrah) continued in the amount 55 mcm per day accordance with contract signed in March 2024.
It is also worth noting the first delivery of an Iranian MGT-70 gas turbine from Iran's Mapna to Russia. It shows strengthening of cooperation in energy area.
In January 2026, another bombing of Iran by the United States, Israel, and the United Kingdom is expected.
Details of Iranian gas market are available here.
Kuwait
Q4 2025 discharge volume amounted to 1.2 million tons. Utilization of the only regas terminal (11.3 MTPA) was 43%.
Traditionally, peak demand for LNG is observed in May-October due to high demand by gas TPP. In winter, demand for LNG is 2-3 cargoes per month.
In 2025, 5.3 million tons of LNG were supplied from Qatar (market share - 69%).
Bahrain
In mid-April, the regasification terminal in Bahrain resumed operations after being idle since 2019.
Only one cargo was delivered in Q4. Overall 2025 import volumes is 686kt.
Egypt
Natural gas balance
Growing demand for gas coupled with shrinking domestic natural gas production, has moved Egypt from an LNG exporter to an LNG importer. As of March 2025, production stands at 117 mcm per day and is falling rapidly (a 35% drop over the year). In 2023-2024, rolling power outages were carried out due to gas shortages.
In August 2025, contract was signed for supply of natural gas from Israeli offshore field Leviathan to Egyptian gas transportation system. Deliveries will begin on 01.01.2026 and its volume will amount to 20 bcma (55 mcm per day). It will extend current gas supplies from Israel via the Arish-Ashkelon gas pipeline with a volume of 26 mcmc per day.
Such sharp transition from exporter to importer, especially given the need to spend money first on the construction of liquefaction plants, and then regasification terminals, indicates poor strategic planning of the country's energy policy.
LNG production
Both of the country's LNG plants, Damietta LNG and Egyptian LNG, are idle due to lack of resource. Only two cargos with total amount 155 kt were loaded in Q4 2025.
LNG import
To meet the demand for gas, Egypt is actively leasing FSRUs. Location of FSRUs:
Ain Sukhna is key port for LNG discharge.
Damietta has started regasification in June 2025.
The main Egyptian regasification hub has been formed in Ain Sukhna: FSRU Höegh Galleon since 2015, FSRU Energos Power and Energos Eskimo since the summer of 2025, FSRU Höegh Gandria starting November 2026.
Earlier in 2022-2025, Egypt used Aqaba industrial port in neighboring Jordan to regasify some LNG shipments. Starting in the summer of 2025, FSRU Energos Eskimo moved from Jordan’s shore to Egyptian.
In June-November 2025, Ertugrul Gazi will be leased from Türkiye for a short-term lease. This is an interesting attempt to use a single FSRU to meet peak demand at different times and locations: heat period in June-September in Egypt, heating period in December-February in Turkey.
Q4 2025 LNG discharges amounted to 3.1 million tons of LNG.
At the moment, LNG supplies are carried out under spot contracts. The Egyptian Government is considering the possibility of concluding long-term contracts. Start of supplies from Leviathan (equivalent to 1.25 million tons of LNG per month) sill temporarily ease the problem.
Türkiye
Q4 2025 discharge amounted to 3.6 million tons. Traditionally, Türkiye actively imports LNG during the cold months from November to March.
On 02.01.2026, Azerbaijan and Türkiye signed an agreement on the supply of natural gas from Absheron gas field in Azerbaijani sector of Caspian Sea with an annual volume of 2.25 bcm (6 mcm per day) starting from 2029 for 15 years via the existing Baku-Tbilisi-Erzurum pipeline.
On 09.01.2026 Australian Woodside and BOTAŞ have signed a long-term agreement to supply LNG to Turkish market. Under the contract, Woodside Energy will supply BOTAŞ approximately 500 kt annually for up to nine years, beginning in 2030. LNG will come primarily from Louisiana LNG project in USA, as well as from other Woodside assets.
Türkiye keeps it energy source diversification.
Details of Turkish gas market are available here.
EU and UK
Gas production
In recent years, Cyprus has discovered a number of large gas fields in its offshore economic zone - Kronos, Aphrodite, Pegasus. The total estimated reserves amount to about 566 billion cubic meters. It is planned to start exporting to the rest of the bloc through Egyptian LNG plants starting in 2027.
In 2025 Romania became top EU gas producer with 22 mcm of average production.
Planned tax on external imports of natural gas
European Commission plans to introduce another tax on the external import of resources to the EU - Methane Regulation (Regulation (EU) 2024/1787). Official wording is based on methane emissions at its production. Transportation and regasification segmets and foreign upstream projects controlled by EU companies will be excluded from the tax. De facto, this is a hidden taxation of gas supplies from the United States, Qatar, Algeria, and Azerbaijan.
In December 2025, the European Commission proposed to the LNG exporter from the United States the procedural facilitation of the “audit” of gas fields. The US Chamber of Commerce once again rejected both the procedural relief and the entire initiative, as the US government basically does not want to pay any tax on its LNG.
Pipeline gas import
For Russophobic reasons, the European Commission requires all EU countries, as well as states planning to join EU, to begin terminating gas supply agreements with Gazprom Export. In Q2 2025 the European Commission presented the following action plan:
Self-restriction of EU countries on conclusion of new supply agreements for pipeline gas and LNG starting from 01.01.2026.
“Termination” of short-term agreements by 17.06.2026.
“Termination“ of long-term agreements tby 01.01.2028 for all EU countries except Slovakia and Hungary.
As of 15.10.2026, this plan has not been agreed.
Since January 2025, Turkish Stream has been the only Russian gas supply channel to EU. In H1 2025, Russian supplies to EU via this route (including re-export of gas outside the EU) amounted to 43 mcm per day, which is 10% of 2021 import volumes. Of these, 21 mcm per day goes to Hungary, 7 - to Slovakia, 15 - to Serbia (including re-exports to non-EU Balkan countries), and 1 - to Greece. Some of physical molecules of Russian gas are likely to enter Ukraine from Hungary and Slovakia as part of Ukraine's commercial imports of European gas.
According to the terms of the agreements, European companies must pay fines for non-taking of gas (take-or-pay clause). The European Commission does not want to pay fines and is looking for ways to sign some kind of paper, according to which unilateral termination of international agreements without penaltieswill be considered “legitimate” in EU. Pocket Stockholm Arbitration Court is likely to be involved in this process. There is already the precedent for “legitimizing” termination of similar contract between Ukraine and Russia without paying contract amount of penalties by Ukraine. This process will finally disconnect EU gas market from supplies from Russia, which will bring additional losses to EU companies and residents and lead to continued stagnation of energy-intensive industries in EU. Even more damage will be carried on by Gazprom. It was gas sales to EU that ensured low level of domestic gas tariffs, as well as Gazprom's generous social program.
In December 2025, Hungarian state-owned energy company MVM signed a contract with Azerbaijan's SOCAR for the supply of 800 million cubic meters of natural gas over 2 years. Hungary is diversifying gas supplies despite supporting Russian gas imports.
Gas stocks at UGS
As of 08.01.2026, stocks of active natural gas in UGS of EU and UK amounted to 63.5 bcm. Stocks are significantly lower than in previous years – minus 13.1 bcm compared to previous year and minus 29.6 bcm compared to 2024.
At the same time, EU and UK are not experiencing a physical shortage of gas due to surplus of regasification terminals on the continent. With stagnant LNG market prices, it is becoming extremely expensive to keep gas at stocks. European Commission accepted risk of complete energy dependence on USA and even started standoff with Qatar and planned complete abandonment of Russian gas import.
Net gas withdrawals out of UGS in Q4 2025 amounted to 18.8 bcm. It is 2 bcm less than in Q4 2024.
Regas terminals
As of 12.01.2026 there are 41 regasification terminals in EU and UK with total capacity 212 MTPA.
In December 2025, Zeeland Energy Terminal developed by VTTI and Höegh Evi passed FID. The terminal will be located in the Vlissingen-Oost port area of Zeeland province of the Netherlands. ZET will be a floating terminal for importing LNG with a direct connection to the country's national gas network. ZET FSRU is scheduled to be commissioned in Q3 2029.
LNG import
The largest discharges in Q4 2025:
France - 5.2 million tons.
Spain - 4.7.
Netherlands - 4/0
UK - 3.7
Italy - 3.4
External LNG imports to EU and UK, excluding regional cabotage, totaled 29.8 million tons in Q4 2025. Utilization of regasification terminals - 56%.
In Q4 USA continued to be the leading supplier of LNG to EU and UK - 17.1 million tons. Share of US import amounted to 57%. Trump's position is to increase the US share up to 100% as new LNG projects are launched in USA and put EU and UK under full energy dependence on US energy supplies.
Russia took the second place in Q4 with 4.1 million tons. Russian supplies are stagnating due to ban on transshipment and re-export of Russian LNG in EU ports. Russia's current share in EU and UK LNG market is 14%.
Qatar continued to be the number three in the ranking of LNG suppliers to the EU and the UK with a volume of 2.3 million tons and 8% share. Qatar is consistently increasing its penetration into the European gas market, including long-term lease of regasification facilities. Qatar Energy aims at controling of supply chain from natural gas well to wholesale gas markets in North-Western Europe.
Details of LNG imports by EU countries are available at the link.
Ukraine
In 2025 Ukrainian gas market has completed its strategic integration to EU gas market and has become integral part of it.
Domestic gas production in Ukraine has been declining almost every year since 1992. The rate of decline in production is about 1-3% per year, on average. The estimated production in 2025 (January-August) is 47 mcm per day.
In early October, Ukraine began to experience a decrease in natural gas production due to failure of production facilities in Kharkov and Poltava regions. According to market rumors, current decrease in production is approximately 60% (~28 mcm per day). A significant part of these production losses will be compensated within 2-6 months.
Ukraine's domestic gas consumption is rapidly declining: in 1992 it was 113 bcm (310 mcm per day), in 2000 it was 73 bcm, in 2010 it was 58 bcm, and in 2020 it was 31 bcm. In 2025, consumption is estimated to be around 19-22 bcm (52-60 mcm per day).
Domestic demand exceeds domestic supply. Starting in 2025, the shortage will be made up for by LNG from the United States, imported through terminals in Poland and Greece, and Russian gas purchased at hubs in Central Europe.
On 01.07.2025, the operators of the gas transmission systems of Ukraine and Poland (OGTSU and Gaz-Systems, respectively) extended the agreement on guaranteed for Ukraine capacity until 30.09.2026. Moreover guaranteed capacity increased to 12.4 mcm per day (4.5 bcm per year). The Polish route de facto receives regasified LNG from the USA at the Swinoujscie terminal. Polish Orlen is a commercial intermediary, buying LNG from USA on its own account and reselling it to Ukraine (DTEK and Naftogaz).
Gas reserves at UGS as of 08.01.2026 amount to 7.4 bcm, which is higher than last year crisis value and in line with war-time value in 2023 and 2024. This volume is sufficient for domestic market in its current form, taking into account depopulation, decrease of per capita consumption, decrease of gas TPP generation and finilization of deindustrialization.
Brazil
Brazil's LNG regas infrastructure consists of 8 terminals with a total capacity of 36 MTPA. LNG traditionally performs reserving function and insures the country's gas-fired TPPs are well supplied by gas during periods of low domestic hydro generation. Hydroelectric power plants accounted for 56% of the country's electricity generation in 2024. 24% was generated by WPP and SPP.
Q4 2025 LNG imports to Brazil amounted to 538 thousand tons. Terminal utilization is a meager 6%.
LNG import in 2025 amounted to 2.0 million tons. At the same time, there are long-term obligations to import LNG under contracts with NewFortress, BP, Centrica, TotalEnrgies, Golden Pass LMG with a total volume of 2.8 MTPA.
Argentina
Argentina is currently an LNG importer. Import volumes are falling:
2023 - 2.0 million tons
2024 - 1.1
2025 - 0.6
Argentins is preparing to be net LNG exporter soon. Argentina has signed the first LNG SPA in a new era. The contract was signed by the Southern Energy consortium with the ex-Gazprom Germany (temporarily stolen by the German government and known during this period as SEFE). The contract provides for the supply of 2 MPTA for 8 years, starting in 2028. This is equivalent to 80% of the capacity of the first FLNG plant of the consortiun. The consortium includes Pan American Energy (40%), Pampa Energy (20%), Harbor Energy (15%), Golar (10%) and the state-owned company YPF (with tiny 15%). The LNG project's resource base is shale gas production in Vaca Muerta formation.
This is Argentina's first LNG project to materialize (apart from the Bahia Blanca floating LNG plant, which lasted about a year). Together with the planned capacities, for which final investment decisions have not yet been made, Argentina will be able to export up to 28 MTPA by 2035. This will make it a significant player in the international market.
Detailed import statistics by country are available at the link.
LNG bunkering
Singapore, Rotterdam and starting this year Shanghai and Shenzhen are the leading LNG bunkering centers in the world.
In Singapore, sales of LNG as bunker fuel keeps growing in 2025 and amounted to 572 kt (48kt per month).
In April 2025, Maritime and Port Authority of Singapore announced plans to increase volume of LNG bunker sales to 3 MTPA in 2028 (250 kt per month). Thus, fivefold increase in volumes is planned compared to 2025. Issuing new licenses for LNG bunkering and construction of the second LNG terminal in Singapore are underway to achieve this goal.
Learn more about Singapore's LNG industry here.
In Rotterdam, 413 kt LNG were sold as bunker fuel in 2025 (34 kt per month).
Also, significant volumes of LNG bunker are sold in Barcelona (Spain), Zeebrugge (Belgium), Tananger (Norway), Klaipeda (Lithuania), Inku (Finland), Long Beach (USA), in other US ports, in ports of South Korea and Japan.
In Q4 the only Russian LNG bunkering vessel Dmitry Mendeleev arrived to Vladivostok in Russian Far East and start bunkering operations there.
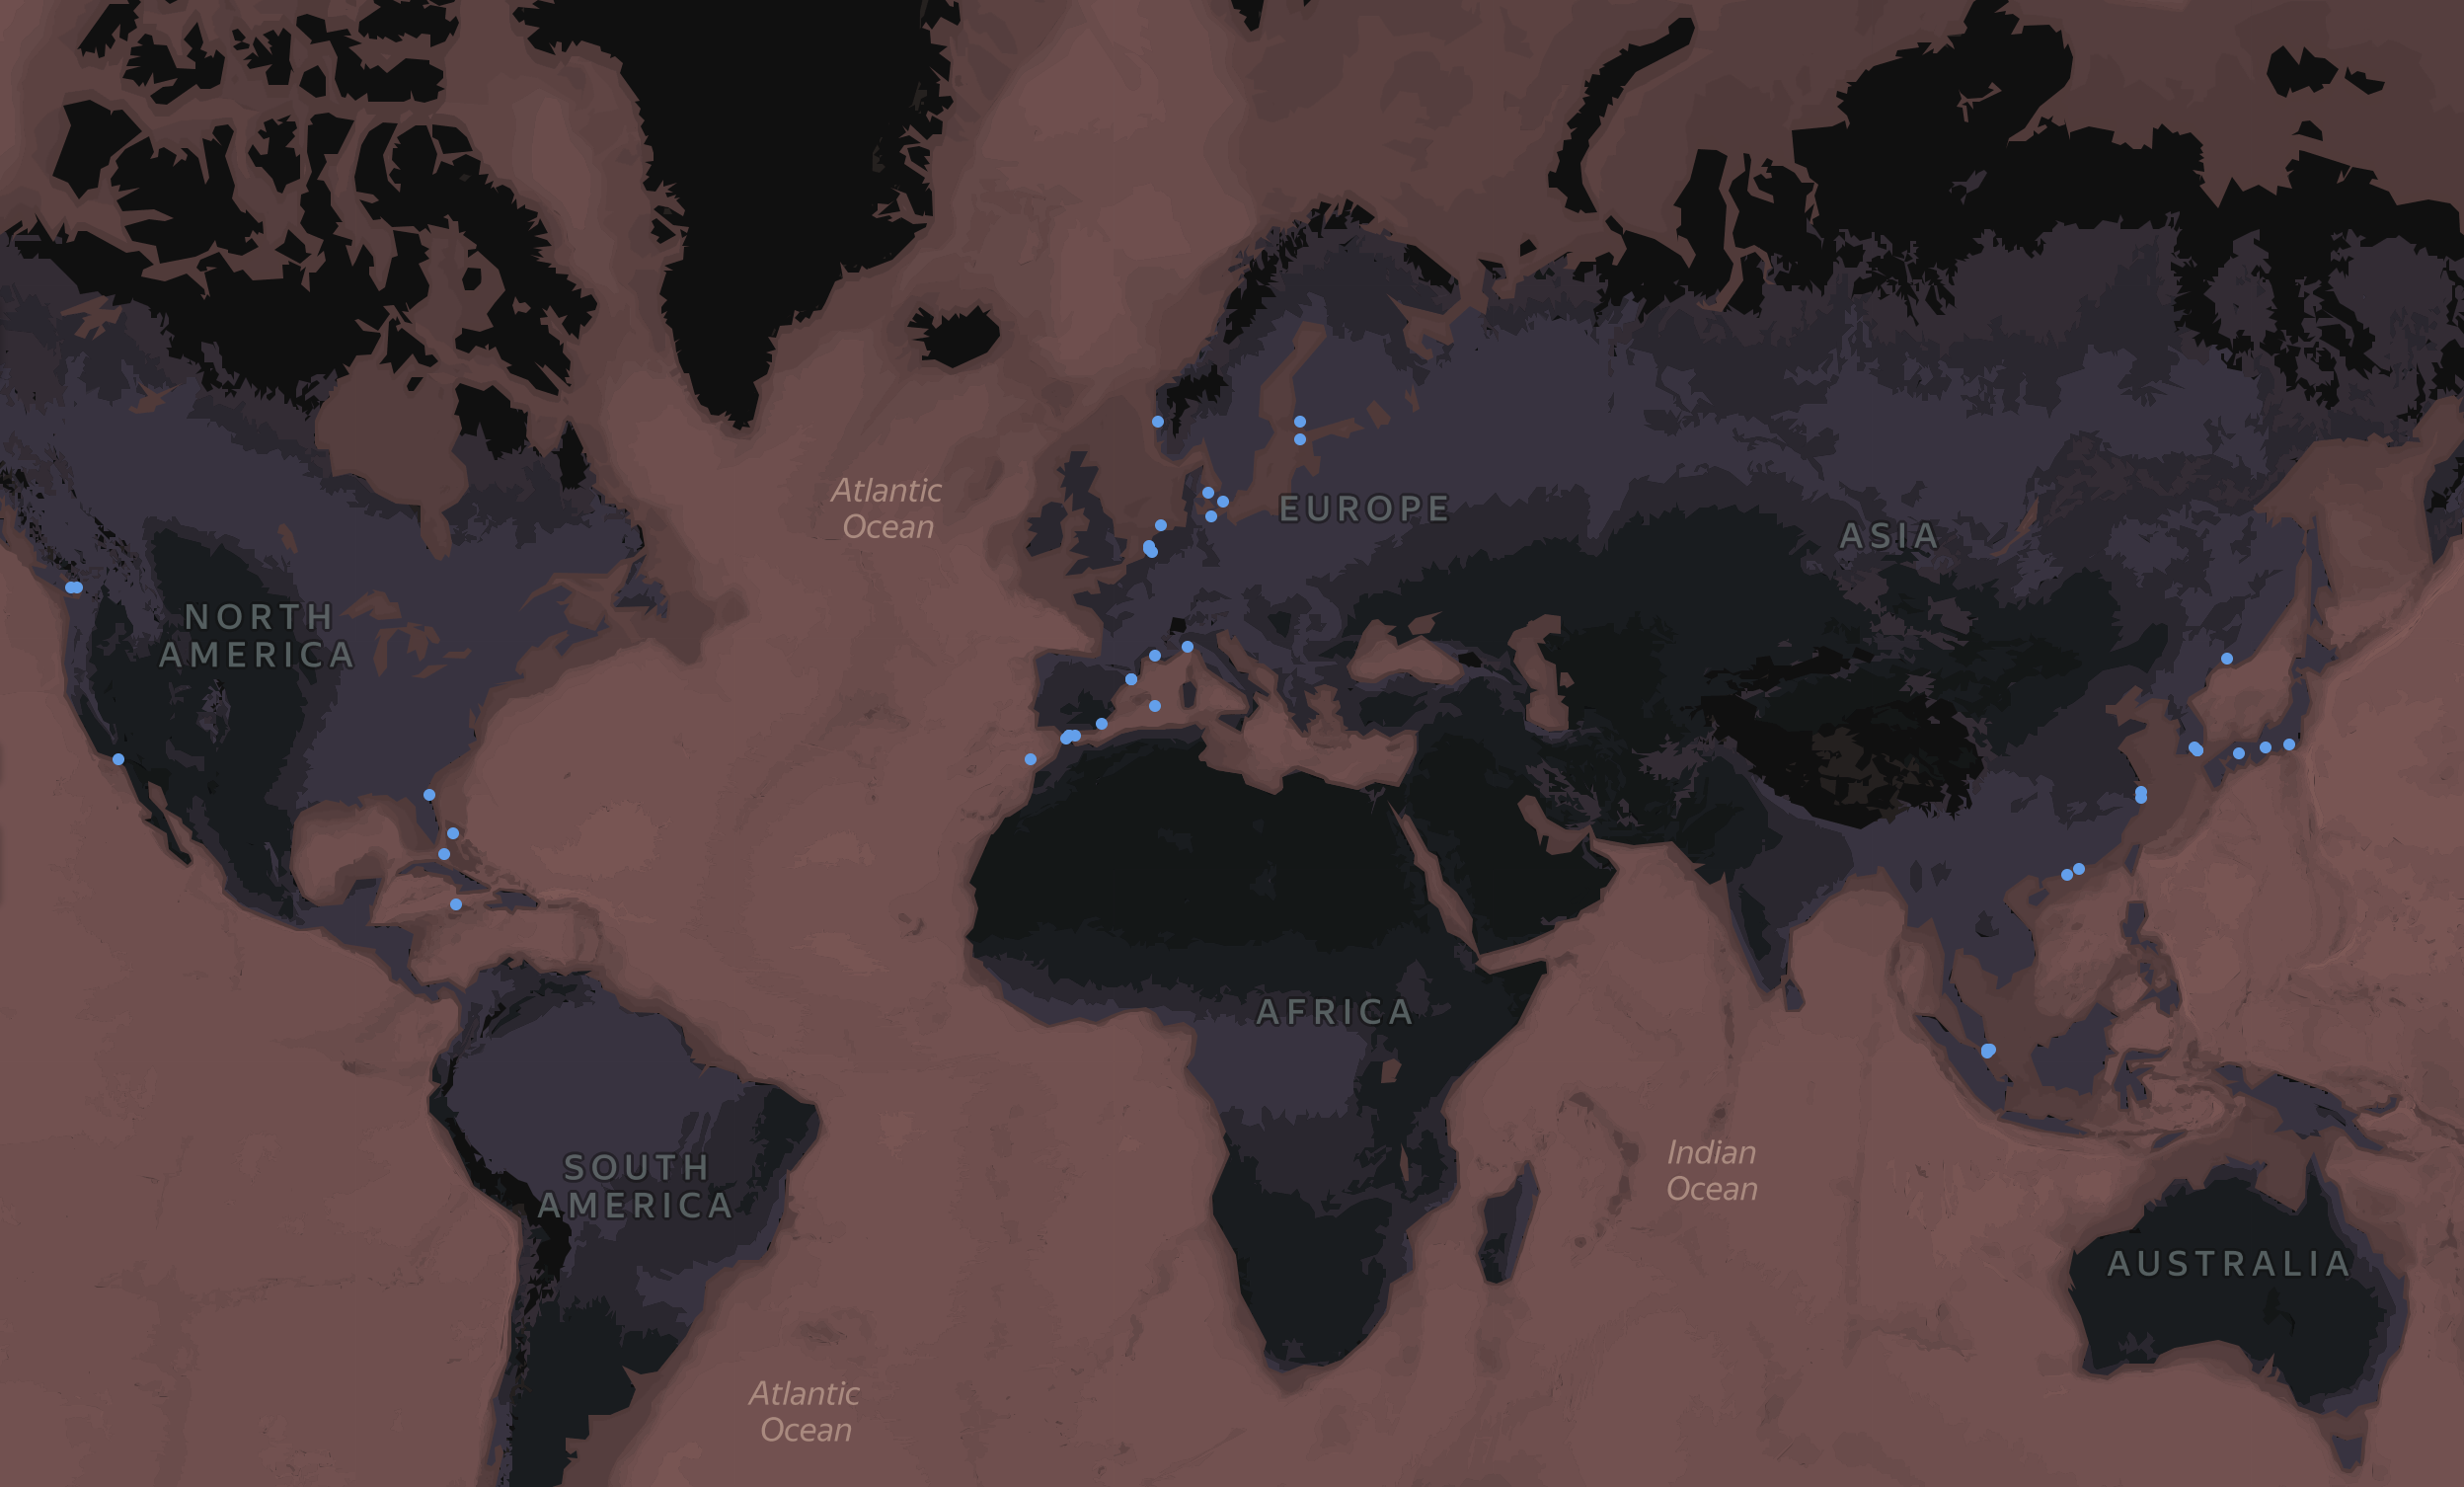
Map of the location of 43 operating LNG bunkers as of 13.01.2026
Fleet
Current fleet
As of 05.01.2026, there are 943 operational LNG carriers, including bunkering vessels, FSRU, FLNG and FSU with 64.1 MT of total cargo hold capacity.
Newbuild
In 2025, LNG carriers with 6.1 MT of total cargo hold capacity were commissioned. It is all-time high value. Y-o-Y increase is 27%.
South Korea is the leader in LNG shipbuilding. Japan, historic leader in the construction of gas carriers, systematically stopped their construction for internal economic reasons. South Korea has won this competition and currently dominates among existing fleet and among LNG vessel under construction.
China pursue South Korea, moving from building relatively cheap oil tankers and bulk carriers to building much more expensive LNG carriers. China is the number two shipbuilder of LNG carriers right now with a dynamically growing market share. Prospects of Chinese shipbuilding are limitless.
Completion on 23.12.2025 of sea trials of LNG carrier Alexey Kosygin (9904546) and its delivery to Sovcomflotallowed Zvezda Shipyard and Russia as a whole to join the very prestigious club of shipbuilders of modern gas carriers. Domestic construction of LNG carriers has tremendous multiplicative effects. Not only will it increase winter shipments from Arktic LNG 2 plany, but it will also revive currently steel industry and create high demand for advanced propulsion and cryogenic equipment. This will create additional jobs for Russian citizens and potential to attract North Korean workers.
Freight rates
During Q4 there was 3.5 times increase in spot rates - from 86 kAED / 168 kCNY / 2.1 mINR / 1.9 mRUB / 23.5 kUSD per day on October 22 to 338 kAED / 653 kCNY / 8 mINR / 7 mRUB / 92 kUSD per day on December 2.
As of December 23, 2025, freight rate is 283 kAED / 544 kCNY / 6.90 mINR / 6.11 mRUB / 77 kUSD per day for a standard modern twin-fuel gas carrier with a capacity of 73 thousand tons of LNG in the Pacific and Indian Oceans.
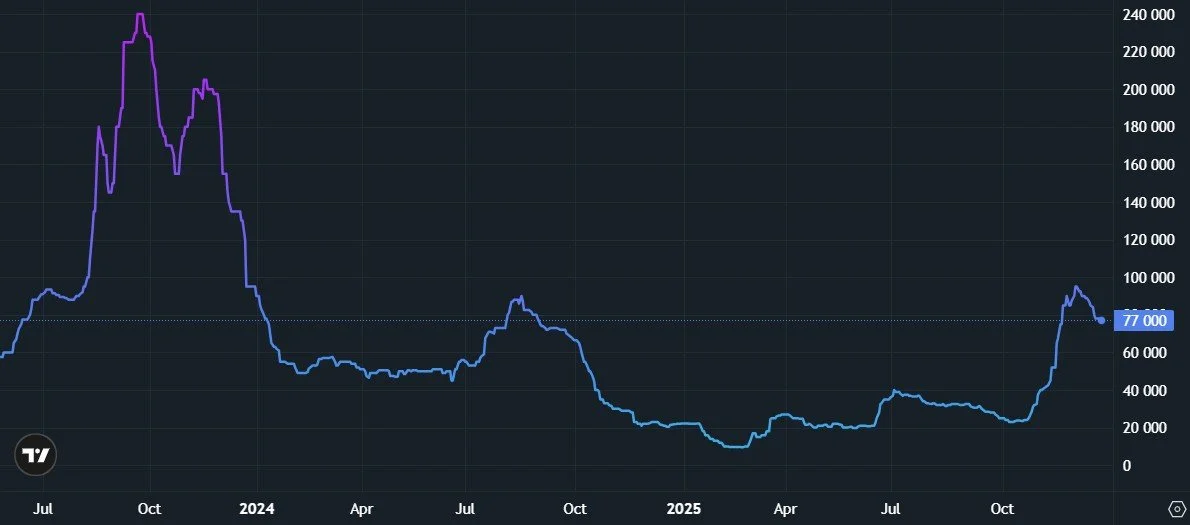
Spot freight rate of an two stroke (ME-GI, X-DF, ME-GA) LNG carrier with 73 kt capacity in Pacific and Indian Ocean region in July 2024 - December 2025, USD /day
Operating expenses for the maintenance of gas carriers can be estimated at 1.2 mRUB / 52.8 kAED / 103 kCNY/ 1.2 mINR /14.4 kUSD per day for a new gas carrier - 63 kAED / 123 kCNY /1.5 mINR / 1.5 mRUB / 17.2 kUSD for a 20-year-old gas carrier with a standard load capacity of 150-170 thousand cubic meters.
US attack on Chinese shuipbuiding industry
One of the first attacks of the second Trump administration was aimed at curbing Chinese shipbuilding industry and simultaneous support of almost extinct US shipbuilding. This pressure could cause huge problems for Chinese economy with high multiplication effect on the whole Chinese economy. At the same time, it is unlikely that the US shipbuilders will win anything in this battle. South Korea will be clearly beneficiary and will raise the price tag for its new LNG carriers.
In the first quarter, the United States imposed an additional duty for the port entry of LNG carriers built in China and/or flying the Chinese flag. In April application of this duty has been revised regarding LNG carriers and some other vessels. Key change relevant of LNG industry that application of additional port duty for China-related LNG carriers postponed to 14.10.2028.
Potential amount of postponed till 2028 duty is estimated as follows: 140 USD (2028 amount) per net ton of LNG carrier, build in China . Capped at 5 portcall per year for each vessel. It is equivalent 17.5 mAED / 34.1 mCNY / 409 mINR / 375 mRUB / 4.8 mUSD per portcall for standard 73kt LNG carrier.
Starting 2028 this amount will be applicable both to Chinese-owned or operated carriers, and other as well. Presumably there will be some exemptions for US-flagged or owned by US company LNG carriers, which were built in China. In addition it is announces that companies could recieve duty refund in case they will order a US-built LNG carrier. But it does not exist.
In addition starting 17.04.2029, the share of US LNG exports required to be transported on US-built, US-flagged, and US-operated vessels will gradually increase each year, from 1% in the first two years to 15% by April 2047. These restrictions will increase incrementally over 22 years.
5% of the current fleet of LNG carriers was built in China. 25% of LNG carriers under constrution are being built in China.
As of 01.07.2025, 42 gas carriers are flying the Chinese flags, including 35 gas carriers flying Hong Kong flag.
In October 2025, China introduced reciprocal additional port fees for vessels owned by U.S. individuals and operated by organizations where U.S. citizens directly or indirectly hold at least 25% of the shares. This measure applies to both U.S.-flagged carriers and vessels built in the United States. The port fees were implemented on October 14, 2025. Fees will initially be charged at a rate of 400 yuan ($56 at the current exchange rate of the People's Bank of China) per net registered ton. It is equivalent 152 mRUB / 7.0 mAED / 13.6 mCNY / 168 mINR / 1.9 USD per portcall for standard 73kt LNG carrier. Starting from 17.04.2026, the fee will be increased to 640 yuan, then from 17.04.2027 it will be increased to 880 yuan, and finally starting 17.04.2028 to 1,120 yuan.
Russian sovereign fleet of LNG carriers
As of December 23, 2025, 17 linear LNG carriers are included in the Western black lists (plus 2 FSOs). Since October 2025, share of Russian LNG shipments by blacklisted LNG carriers has been growing. In November 2025, LNG loading to blacklisted LNG carriers amounted to 1 million tons. It is equivalent to 25% of the total volume of LNG loadings in Russia, including transshipment.
Evolution of the global LNG carrier fleet
Consequences for the LNG market depend on the overall outcome of the US-Russia and US-China confrontations and effectiveness of Russia-China cooperation. It is difficult to predict these consequences, but we will try to do it a form of extreme scenarios:
Scenario of “Splitting the LNG trade into parts“. In this scenario, China, losing the US market for direct supply of its products of a wide range, integrates more with friendly and neutral countries for it (CIS, Africa, Latin America). In terms of LNG, this means China abandoning LNG supplies from the United States and refocusing on LNG supplies from Russia while maximizing pipeline gas flows from Central Asia and Myanmar. In this case, Russian gas companies find both a sales market and solve all problems with the payment and maintenance of the fleet of gas carriers. USA will is increase LNG supplies to EU, UK, Japan and South Korea.
“US victory in the trade war" scenario. In this scenario, China increases LNG imports from the United States, similar to the results of Trump's first trade war against China. Imports of LNG from Russia are likely to decrease, as well as the provision of technical services and equipment supplies by Chinese companies to Russian contractors in the LNG industry. The LNG market remains unified, but without Russia's participation in it.
Price dynamics
Asia
LNG spot price in East Asia (JKM) as of 12.01.2026 was 9.73 USD/MMBtu, which is equivalent to 27.15 RUB / 1.27 AED / 2.41 CNY / 31.1 INR / 34.45 US cents per cubic meter of natural gas. LNG excess led to price stagnation even despite high season (-10% compared to end of Q3).
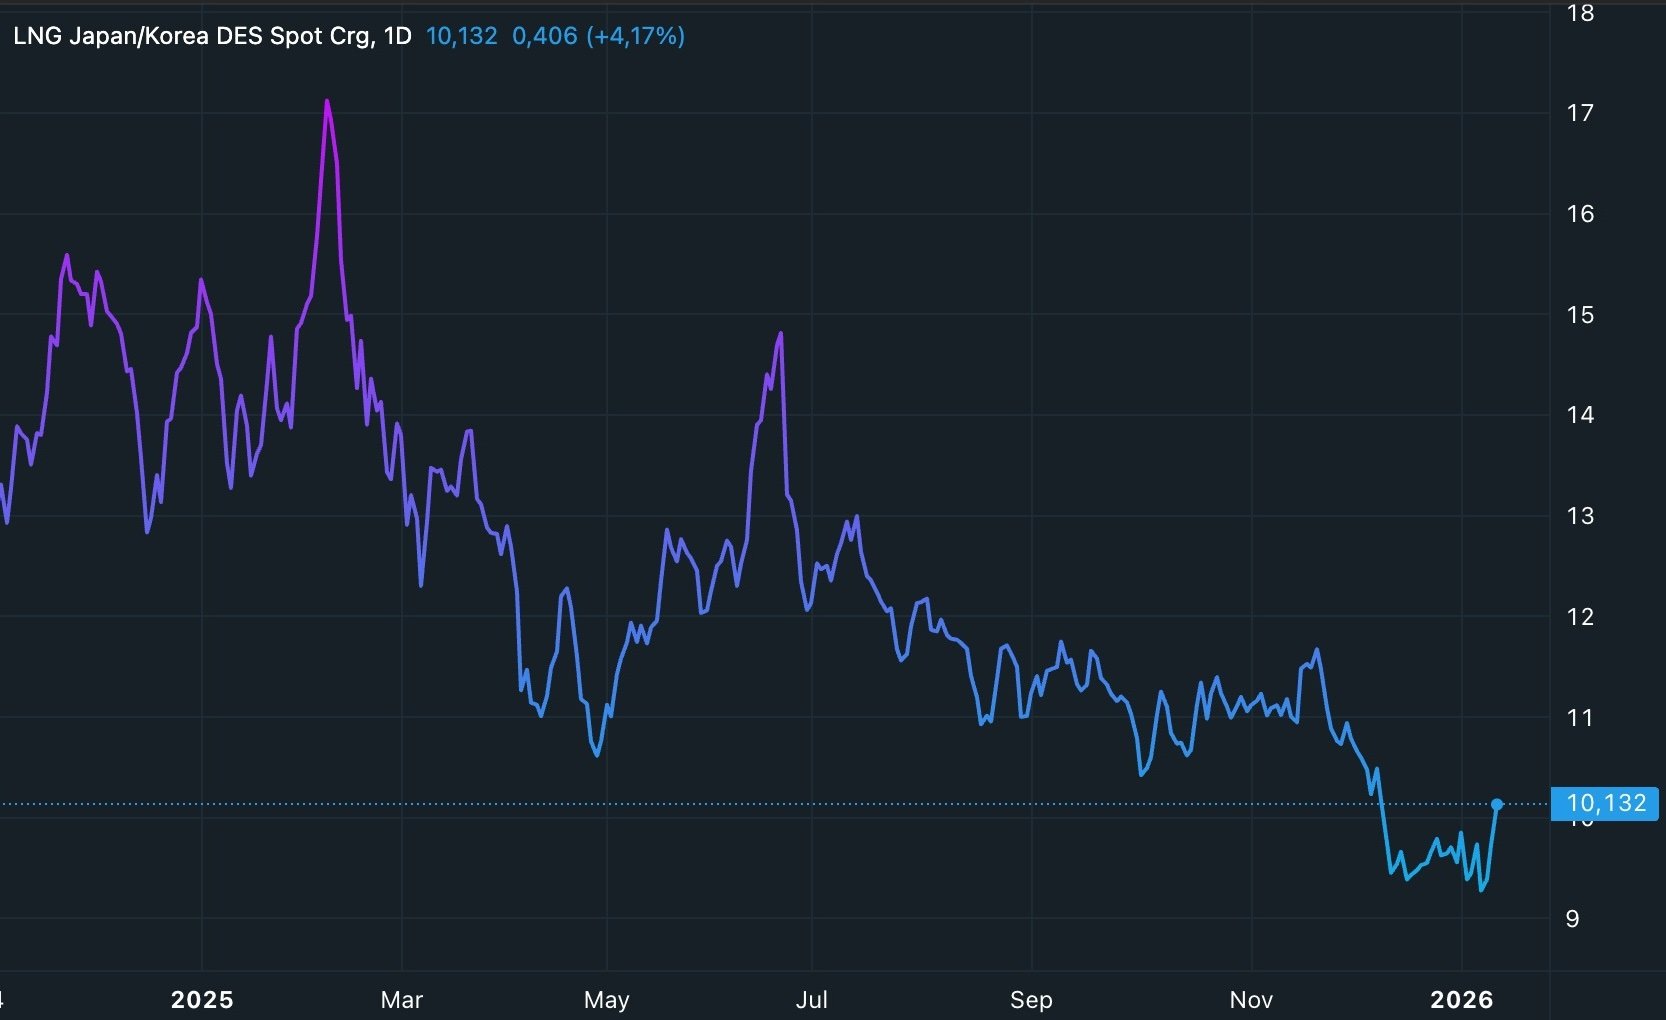
Price quotes for spot shipments of LNG to ports in Japan, South Korea and Taiwan Province of China (JKM) in January 2025 - January 2026, USD/MMBtu
Wholesale LNG prices at a port of an importing country do not include costs of regasification, distribution to end users, taxes, fees and profits of gas companies. Energy in Japan and South Korea continues to be relatively expensive.
Long-term LNG futures prices on Singapore Stock Exchange shows price stagnation in coming years. Long-term futures quotes as of 12.01.2026:
2027 - 8.98 dollars per million British thermal units (quote on 08.01.2025 - 10.45, on 08.04.2025 - 10.28, on 10.07.2025 - 11.32, on 10.07.2025 - 10.30). Decrease of 8% from the current spot price.
2028 - 8.78 dollars per million British thermal units (quote on 08.01.2025 - 9.00, on 08.04.2025 - 9.23, on 10.07.2025 - 10.18, on 10.07.2025 - 9.48). Decrease of 10% from the current spot price.
2029 - 8.46 dollars per million British thermal units. Decrease of 13% from the current spot price.
Despite that trading of these long-term futures is not very liquid, it reflects the market's opinion about LNG surplus during future time periods.
EU
Spot gas price in EU (TTF) as of 13.01.2026 was 381 USD per thousand cubic meters, which is equivalent to 30.0 RUB / 1.40 AED / 2.66 CNY / 34.4 INR / 38.1 US cents per cubic meter of natural gas. There is no change compared to 10.10.2025.
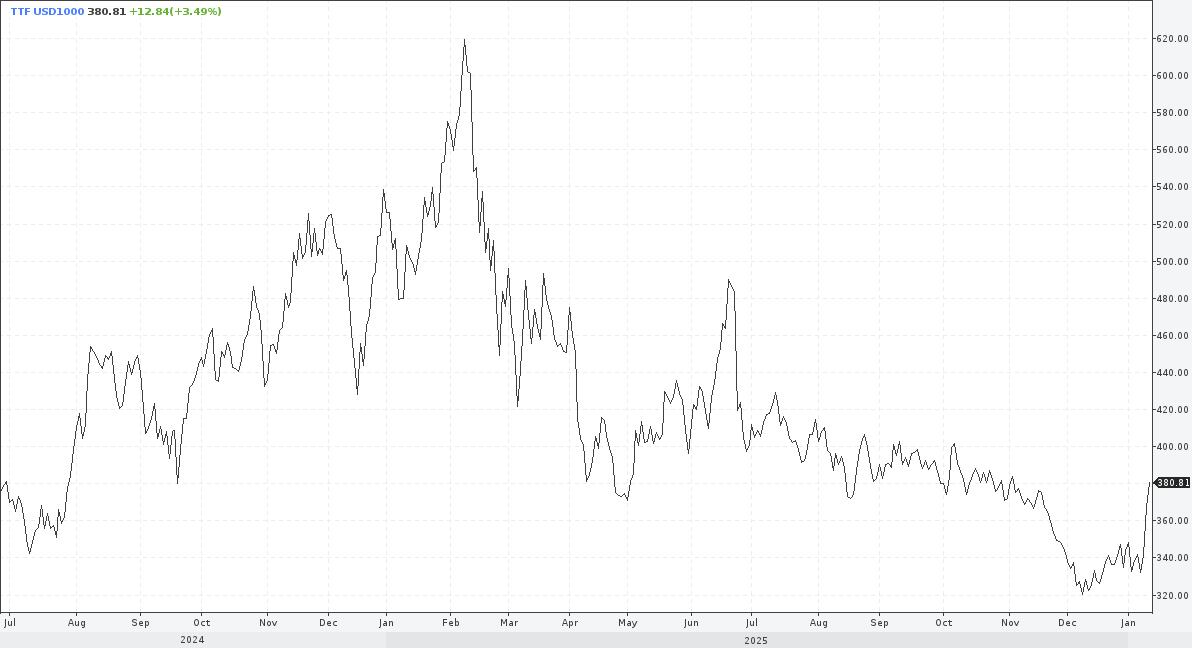
Exchange prices for gas at the TTF hub (Netherlands) in July 2024 - January 2026, dollars per thousand cubic meters
European gas prices continue to be relatively high. Voluntary self-ban on import of cheap Russian piped gas to EU is leading to transfer of energy-intensive industries, primarily chemical ones, from EU to USA and Middle East, as well as increased global competition from Chinese manufacturers, who continue to massively introduce gas processing facilities.
Russia
Settlement of the National exchange index of natural gas for July 2025 delivery on the Petersburg Exchange (formerly the St. Petersburg International Mercantile Exchange, SPIMEX) was 6.00 RUB / 0.28 AED / 0.53 CNY / 6.87 INR / 7.62 cents per cubic meter of natural gas.
Exchange-traded volumes are equal to 3% of domestic consumption of natural gas. There is huge potential of increasing share of gas sold via the exchange.
Domestic gas marker prices and cost of Russian LNG exports aren’t linked as of now. Gas production, liquefaction and export at Yamal LNG and Sakhalin Energy plants are independent of Gazprom's Unified Pipeline Network. Only plants consuming network gas are medium-tonnage plants Cryogaz-Vysotsk and Gazprom LNG Portovaya, which have practically suspended LNG production and consumption of network gas (annual consumption at the current rate of operation is less than half bcma).
USA
Wholesale gas prices in the United States continue to be among the lowest in the world. February 2026 Henry Hab price as of 12.01.2026 was 3.40 USD/mmBTU, which is equivalent to 9.48 RUB / 0.44 AED / 0.84 CNY / 10.9 INR / 12.03 US cents per cubic meter of natural gas. November 2025 Henry Hab price as of 09.10.2025 was 3.28 USD/mmBTU. QoQ growth - 4%
Spot LNG shipments from the United States to the EU and the United Kingdom with a price formula linked to the Henry Hub have near-zero margins for independent traders. Its spot shipments to East Asia have extremely thin margins and continue to decline. Spot supplies by vertically integrated LNG producers and buyers continue to be in the green zone.
Market view for Q1 2026
Primary consumption of natural gas in traditional LNG markets in Q1 is traditionally high in line with seasonal trends. Character of winter in Europe will determine demand for natural gas in the region, global LNG imports and level of market prices in February-March 2025.
EU has sufficient gas stocks in UGS. Given the stagnating LNG prices, it is expensive to keep large gas stocks in UGS. Therefore, the decisions of European Commission regarding the “obligations” to USA to keep switching to importing exclusively LNG from USA, while simultaneously banning Russian LNG and attempting to tax Qatari gas, play a key role. Political decisions completely determine EU gas market.
Trump can add new shock to the LNG market at any time, including new initiatives on so-called “mutual” tariffs (new 25% for Iran's trade partners, continued unilateral duties on Chinese and Indian exports to USA, etc.), new wars (bombing Iran, seizing Greenland and other), beginning of new round of pressure on Russia (Yamal LNG, non-renewal of so-called permits for Japan, Beihai terminal). To support its export industries, USA is actively clearing international markets. LNG industry is extremely important to Trump administration. Therefore, sanctions against Yamal LNG and Sakhalin-2 are likely in 2026.
If Trump captures Greenland, EU will not be able to refuse to import US LNG.
In 2026, active commissioning of LNG capacities and LNG carriers will continue. Figures for 2026 will exceed those for 2025, which will create new pressure on market prices.
DES LNG prices are expected to be in the range of 9.2-10.0 USD mmBTU during Q1.
Notes:
Join Seala AI’s Linkedin page to be informed for all new future releases with new dashboards and insights.
Non-mainstream oil and gas news and views are available in Seala AI’s telegram channel.
Full set of reports for each country and much more information are available via Seala AI terminal.